
Market Snapshot
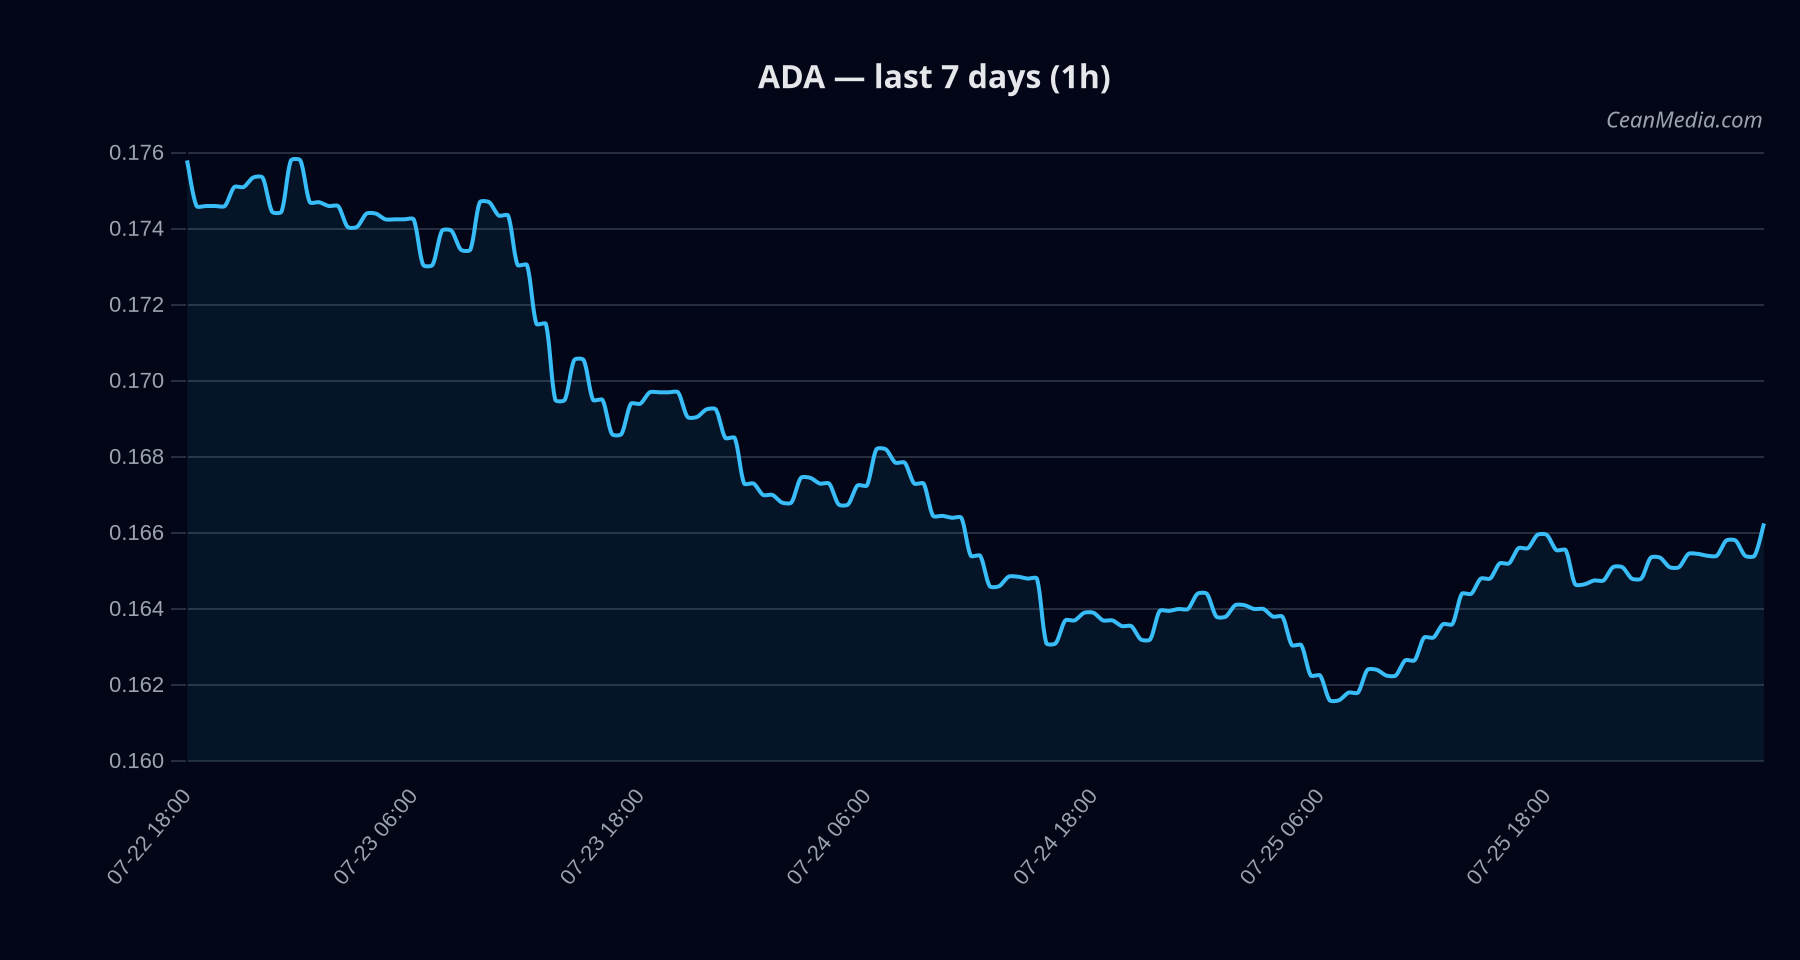
Cardano (ADA) is trading near support at 0.165 and within a defined range up to 0.17, with a recent close around 0.1665. The broader market shows very low volatility and a mixed risk mood, while breadth remains positive in the immediate horizon. The asset’s intra-range dynamics suggest a cautious stance with potential for a breakout if key levels are breached.
Technical Analysis: ADA
Sideways trend (RSI 63). EMA12>EMA26 and SMA50 Close at 0.1665. Forecast range P50: 0.1646; P20-P80: 0.1565–0.1879. Support near 0.165, major 0.16; Resistance near 0.17, major 0.175. Market context shows a very low volatility regime with breadth 100% above SMA50, and BTC correlation around 0.60, indicating some cross-market linkage but not a primary driver for ADA moves in the near term.
Drivers
Return 24h: 0.02, EMA slope: 0.001, Basis Z-Score: 0.185, Order-book imbalance (EMA5): 0.028, BTC return 24h: 0.0067. Vol regime: Very low; vol-of-vol positive modest signal, trend strength rising (value ~1.81). Overall momentum remains mixed with a tilt toward sideways movement in the near term. Fear index around 26; cross-market risk assets softer; stablecoin liquidity contracting slightly over 7 days; BTC correlation remains elevated but not decisive for ADA directional moves.
ETF Flows (BTC/ETH)
The ETF flow context provided is limited to BTC and ETH instruments, illustrating near-term risk-on/off dynamics from broader market funding and asset rotation. BTC ETFs show a notable net outflow in 1D, with continued outflows over 5D and 10D magnitudes, while ETH ETFs show mixed signals with inflows over 5D and 10D. This data should be interpreted as market context rather than a primary signal for ADA. The absence of direct ADA ETF exposure means flows should be considered as macro risk sentiment indicators that may influence correlations and risk appetite across crypto assets.
What to Watch Next
- Break above 0.17 could open toward 0.1732–0.1766, validating a bullish tilt within the current sideways regime.
- Break below 0.165 could accelerate toward 0.1599–0.1566, increasing near-term downside risk.
- Monitor volatility regime and breadth signals, as a shift from very low to higher volatility could precede a more decisive move.
- Observe cross-market risk sentiment (BTC correlation) for potential spillovers into ADA liquidity and demand.
Hashtags: #ADA #CryptoAnalysis #TechnicalAnalysis #MarketSnapshot #ETFFlows #BTC #ETH #Altcoins #CryptoMarkets #PriceAction #RiskManagement #TradingSignals