
Market Snapshot
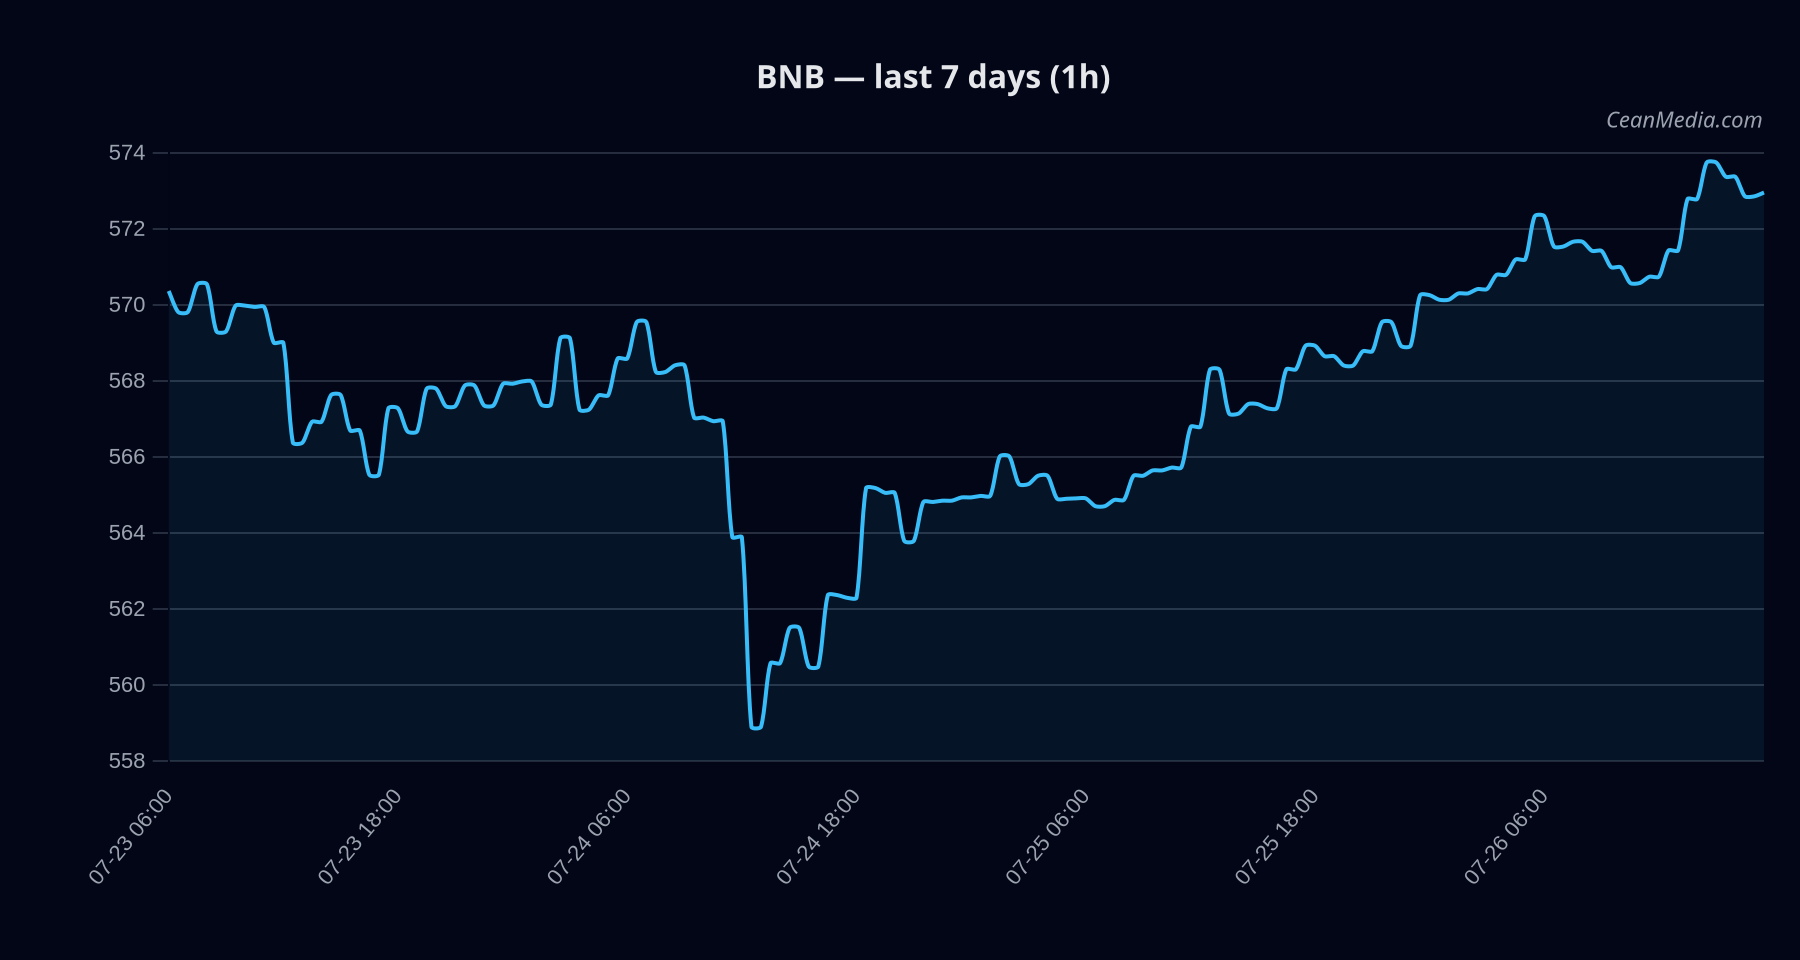
Date: 2026-07-26/27. Primary asset: BNB. The near-term bias is described as slightly bearish with a low certainty level (29/100). Composite score stands at -2.0 with minimal data gaps (2%). The price closes around 572.86 as of the latest data tick. Market breadth is robust at above-mean levels (>50h) and BTC correlation over 72 hours remains elevated (~0.71), suggesting a risk-on context supports cross-asset moves, albeit with a very low volatility regime.
Technical Analysis: BNB
- Price Action: Close at 572.86. Trading range forecast (P20-P80): 558.0 – 586.6; P50 at 572.50.
- Trend: TA trend described as sideways. RSI at 65—near overbought threshold but within neutral range. EMA12 > EMA26 and SMA50 < SMA200 support a mixed, range-bound setup.
- Volatility: Very low regime (σ24h 0.11%, ATR 0.5443). Volatility regime supports tighter ranges and less breakout impulse.
- Key Levels:
- Support near 561 (major 566)
- Resistance near 584 (major 580)
- Triggers:
- Up: 1h close above 584 targets 596.00 – 607.69
- Down: 1h close below 561 targets 550.17 – 538.95
- Invalidation: Breakouts beyond key levels would alter the bias away from current sideways posture; confirmation required on a sustained close beyond thresholds.
Drivers
- Top model drivers include Return 24h, EMA slope, and Basis Z-score, contributing to the near-term directional assessment.
- Funding Z-score and OBI (order-book imbalance) provide near-term momentum considerations within a low-volatility environment.
- Market context shows risk assets softening in cross-market signals, with Fear index around 26, and stablecoin liquidity modestly contracting over 7 days.
- BTC-dominance around 56.4% with a 24h correlation of 0.71 suggests BTC-led moves may influence BNB in the short term, though BNB-specific TA remains the primary signal.
ETF Flows (BTC/ETH)
Contextual note: ETF flow data presented here is for BTC and ETH only and is not a primary signal for BNB. The figures provide macro context on risk appetite and liquidity conditions in associated markets.
- BTC ETF: 1D flow −$240.1M; 5D −$60.6M; 10D −$320.7M. Indicates a persistent outflow pressure over multiple horizons, suggesting cautious risk-off tendencies in the BTC space.
- ETH ETF: 1D flow −$70.7M; 5D +$102.5M; 10D +$98.1M. Mixed signals with short-term outflows but longer-run inflows, implying selective risk bidding in the Ethereum complex.
What to Watch Next
- Watch for a daily close above 584 to validate a potential upside extension toward 596–608.
- Monitor a break below 561 for confirmation of a near-term downside pathway toward 550–539.
- Keep an eye on BTC/ETH ETF flow shifts as potential amplification or decoupling signals in the broader risk-on/off environment.
- Maintain awareness of volatility regime changes; a shift from very low to higher volatility could precede a more decisive breakout.
Hashtags: #BNB #cryptomarket #technicalanalysis #ETFflows #BTC #ETH #risksignal #riskon #riskoff #volatility #momentum