
Market Snapshot
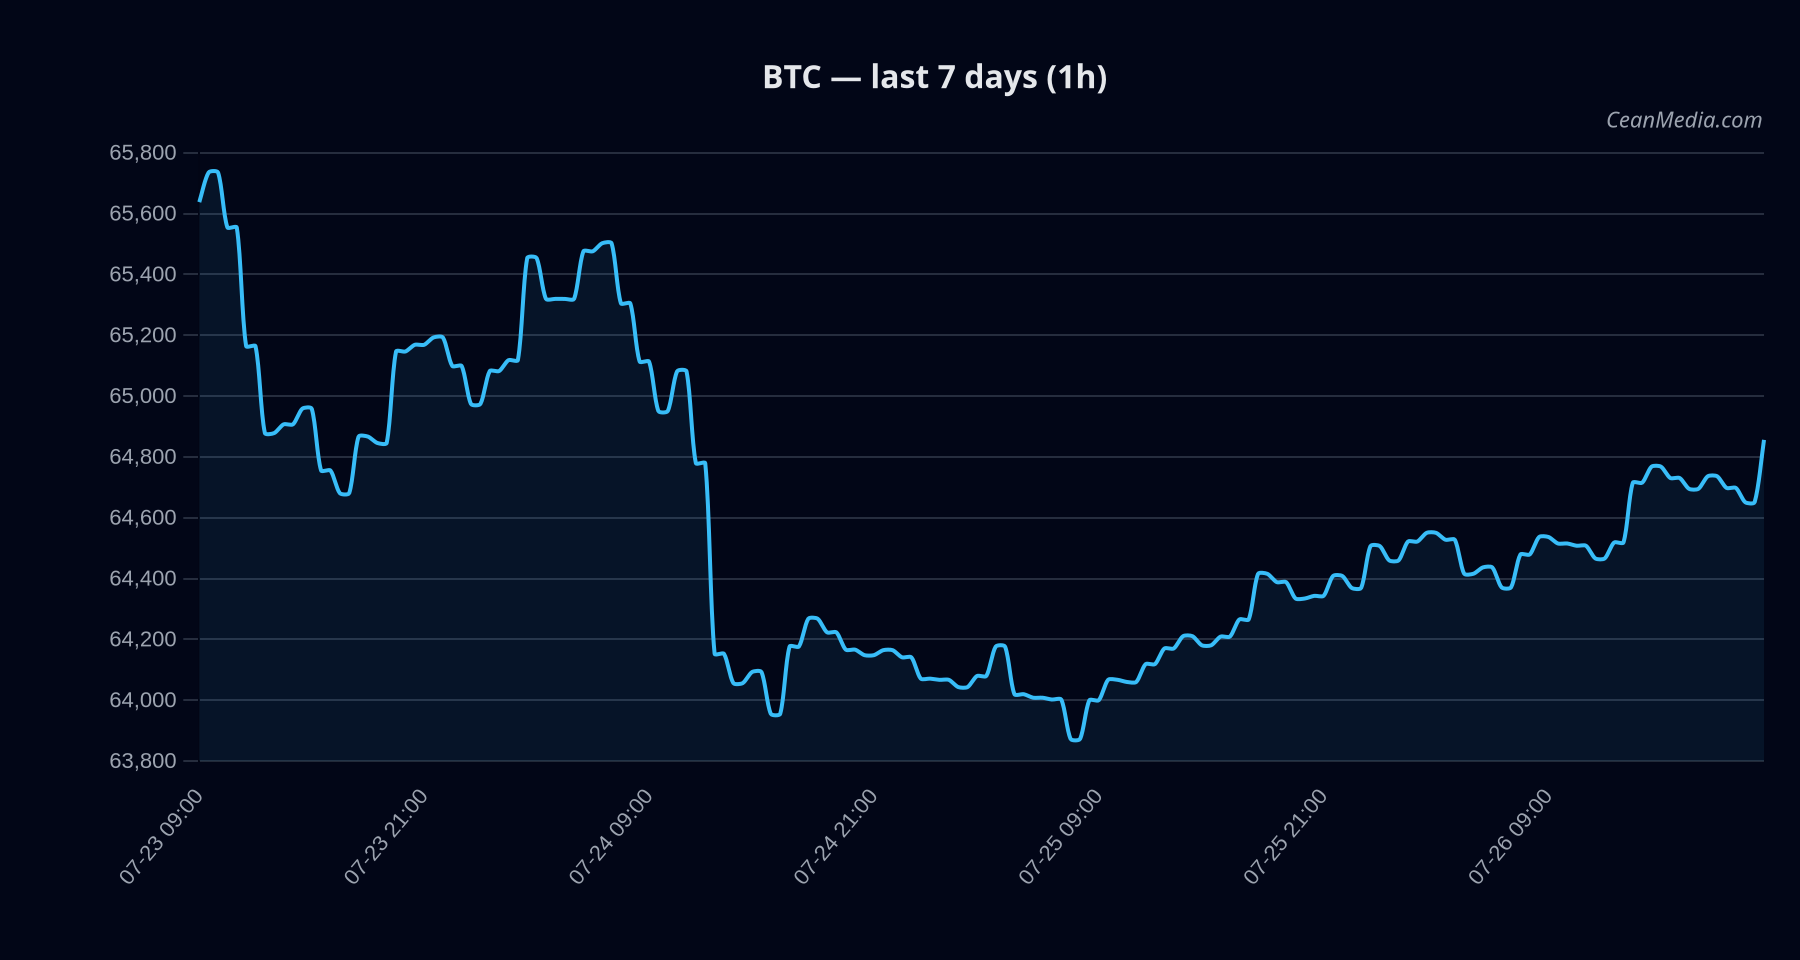
Bitcoin (BTC) sits within a defined range with near-term directions guided by intraday price action and macro risk sentiment. The latest data show a mixed/neutral bias with a relatively high RSI indicating near overbought conditions, yet the trend remains sideways. Market breadth is strong above the 50-period moving average, and BTC has a high correlation with broader risk assets.
Technical Analysis: BTC
- Price: Close 65,233.81
- Bias / Certainty: Mixed / neutral, certainty low (11/100)
- Composite score: -0.7 (conflicts 0)
- Trend & Indicators: Sideways TA trend; RSI 76; EMA12>EMA26; SMA50
- Forecast: Model shows up (50%), with down (35%) and side (15%) probabilities; close to overbought territory implied by RSI
- Forecast Range: P50 65,219.92; P20-P80 62,560.80 – 66,525.31
- Key Levels:
- Support: 63,925 (near), major: 63,175
- Resistance: 66,550 (near), major: 65,850
- Triggers:
- Up: 1h close > 66,550 → potential target 67,869.26 – 69,200.03
- Down: 1h close < 63,925 → potential target 62,650.55 – 61,371.97
- Context: Breach above/below key levels would generate confirmation signals; current context suggests waiting for a breakout to confirm trend direction.
Drivers
- Top drivers indicate a balanced momentum with modest upside pressure: Return 24h (~0.8%), EMA slope (~0.05%), and funding basis metrics are mixed.
- Key risk factors: Basis Z-score notably negative (-3.50), implying potential overextension in pricing vs. model baseline; vol regime remains very low, suggesting a quiet market environment despite elevated RSI.
- Macro/Market context: Cross-market risk assets/sluggish volatility; fear index at 26; BTC-dominance around 56.42% with minimal 24h drift.
ETF Flows (BTC/ETH)
The ETF flow data provided covers BTC and ETH only and should be interpreted as contextual signals rather than primary drivers for BTC price action. Recent data show ETF flows in the BTC space negative for 1D (-$240.1M), with multi-day trends also negative, while ETH flows are mixed. This context can reflect reallocation preferences rather than direct predictive power for BTC moves.
- BTC ETF Flows: 1D -$240.1M; 5D -$60.6M; 10D -$320.7M
- ETH ETF Flows: 1D -$70.7M; 5D +$102.5M; 10D +$98.1M
What to Watch Next
- Monitor for a decisive close above 66,550 to validate the upside breakout pathway and target 67,869–69,200.
- If BTC breaks below 63,925, watch for a swift move toward 62,650 and then 61,372 as downside targets.
- Remain aware of ETF flow shifts in BTC/ETH, as larger reallocation could influence near-term sentiment although described as contextual rather than primary signals.
- Be mindful of RSI staying in overbought territory while price action remains range-bound; a rising volume spike could precede a breakout.
Hashtags: #BTC #Bitcoin #MarketAnalysis #TechnicalAnalysis #ETFFlows #CryptoMarkets #PriceAction #RSI #Breakout #SupportResistance #MarketContext