
Market Snapshot
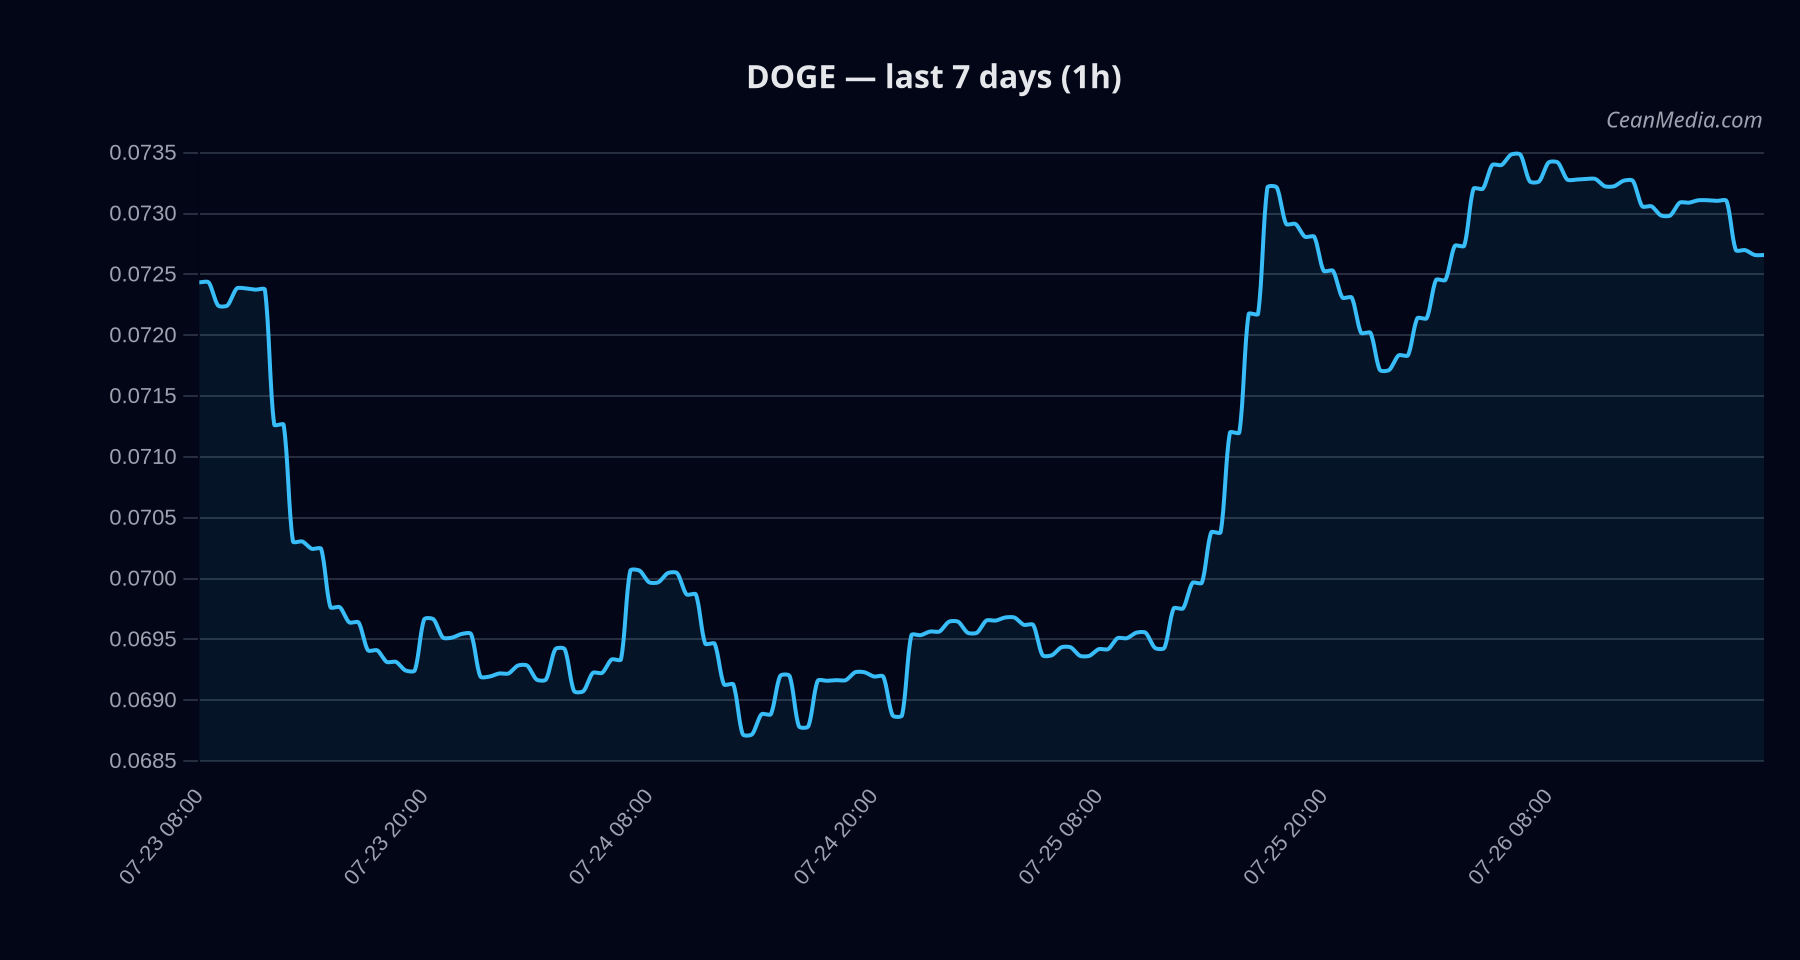
As of 2026-07-26, DOGE is trading around 0.0727 with a very low volatility regime. Market breadth remains positive (>50h) at 100%, and BTC correlation over 72 hours sits at 0.32, indicating a modest, non-dramatic cross-asset influence. The overall composite picture shows a bearish bias with low certainty, and the model forecast tilts toward potential downside in the near term if support breaks.
Technical Analysis: DOGE
- Current price: 0.0727
- Bias: bearish (certainty 37/100)
- Composite score: -2.6
- TA trend: sideways
- RSI: 53
- Key moving averages: EMA12 > EMA26, SMA50 < SMA200
- Volatility: σ24h 0.30%, Vol regime: Very low
- Forecast range (P50): 0.0732
- Support: near 0.071; major 0.07
- Resistance: near 0.074; major 0.074
- Triggers:
Up: 1h close > 0.074 → 0.0756 / 0.0771
Down: 1h close < 0.071 → 0.0698 / 0.0684 - Invalidation considerations: breakouts outside defined triggers would require re-evaluation of the composite signal; the current posture remains within the 0.071–0.074 range.
Drivers
- SPREAD BP: -2.39 (value 5.59)
- FNG Z-SCORE: 1.64 (value 6.09)
- LS GLOBAL DELTA 24H: -1.17 (value 3.14)
- STABLE MCAP LOG1P: 0.87 (value -2.14)
- LS TOP DELTA 24H: 0.87 (value 2.99)
- STOCK TSLA RET 1D: -0.61 (value -1.94)
- Momentum/volatility context
- Cross-market risk assets soft (macro context)
- Fear sentiment around 26 on F&G index
- BTC 7d price action and dominance provide contextual backdrop but are not primary DOGE signals
ETF Flows (BTC/ETH)
The ETF flow data provided is limited to BTC and ETH flows. BTC ETFs show net outflows over 1D (-$240.1M) and cumulative negatives over 5D (-$60.6M) and 10D (-$320.7M). ETH ETFs show modest 5D inflow (+$102.5M) but a 1D outflow (-$70.7M) and a 10D inflow (+$98.1M). This data should be interpreted as context for risk appetite shifts rather than a direct DOGE signal. In other words, ETF flows can reflect broader risk-off or risk-on sentiment but do not necessarily drive DOGE-specific moves.
What to Watch Next
- Monitor 1h close relative to 0.074 resistance for potential breakout toward 0.0756–0.0771 if triggered.
- Watch for a break below 0.071 support to validate a near-term downside path toward 0.0698–0.0684.
- Assess changes in macro risk appetite, especially cross-asset signals from BTC/Dominance shifts and fear/greed indicators.
- Reassess when ETF flow commentary shows a persistent shift in BTC/ETH risk-on/off, as this can influence correlated asset classes.
Hashtags: #Dogecoin #DOGEanalysis #CryptoTechnicals #MarketSnapshot #ETFFlows #CryptoMarkets #RiskOnOff #BTC #ETH #Altcoins #TechnicalTrading #PriceLevels