
Market Snapshot
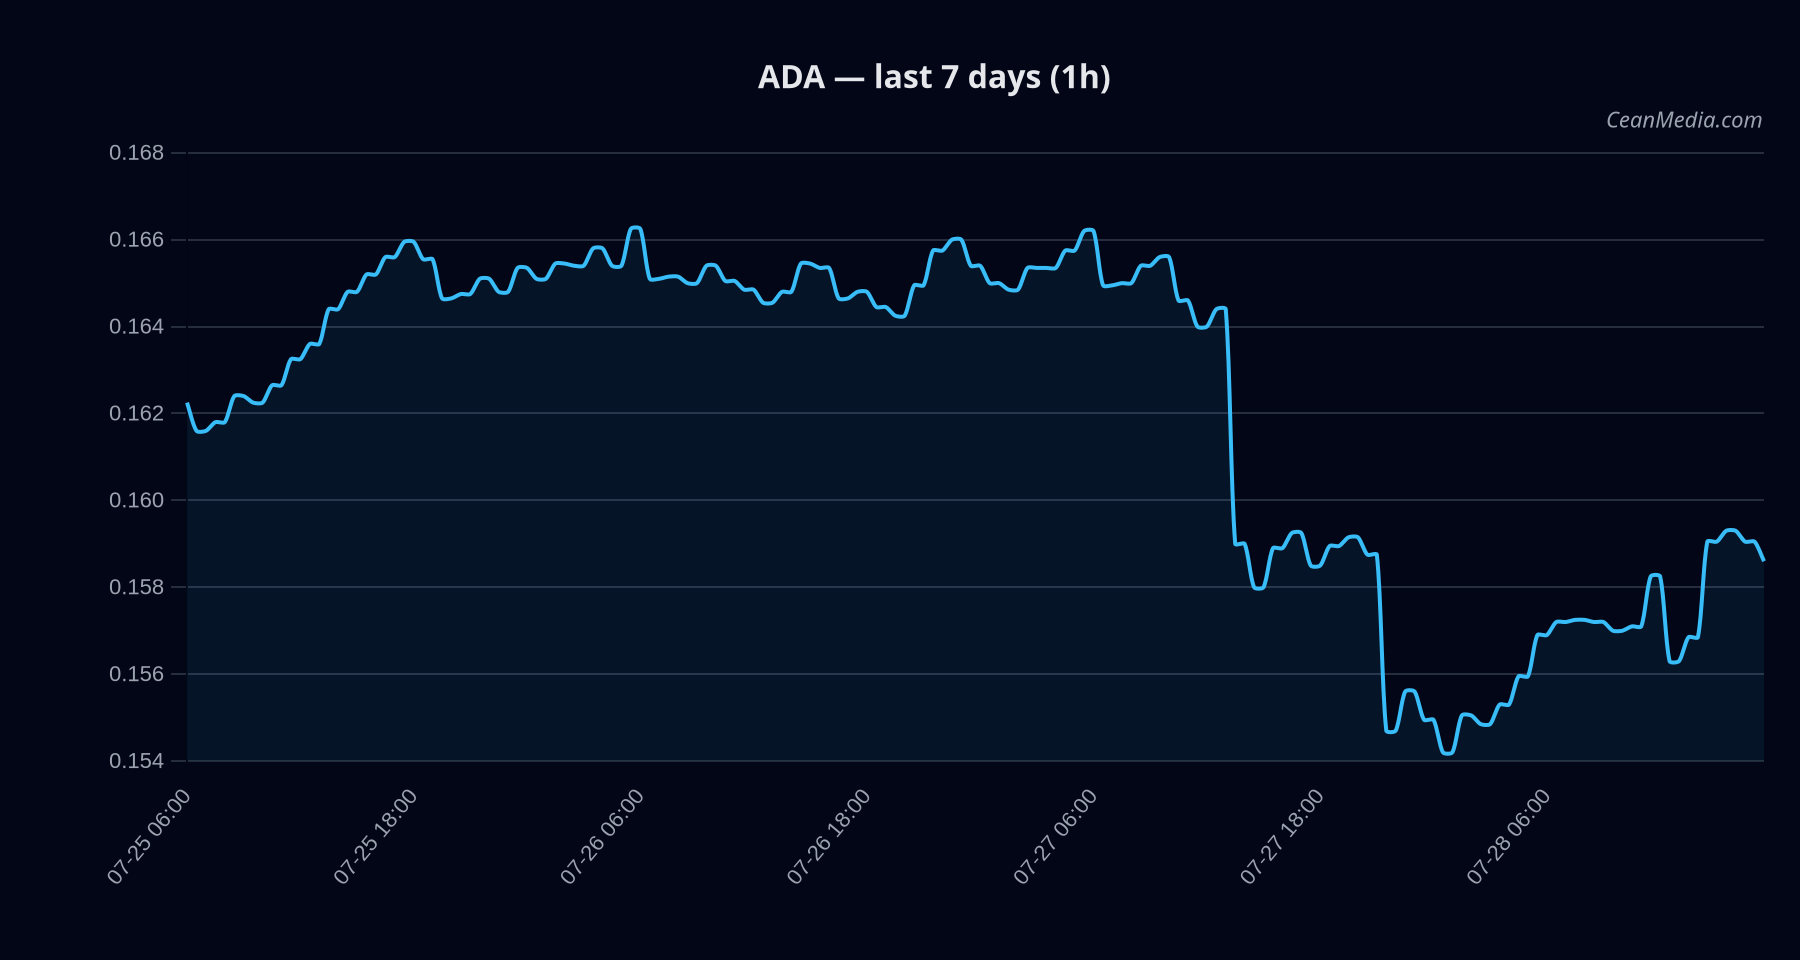
Cardano (ADA) remains under a slightly bearish bias with a low certainty environment. The latest close is 0.1583, with a forecast range suggesting potential for further downside but contained within a narrow band given very low volatility conditions.
Technical Analysis: ADA
- slightly bearish | certainty 19/100
- -1.3 | conflicts 0
- 0.1583
- TA trend bearish; RSI 50
- EMA12
- Down (48%); Up 40%; Side 11%;
- Support near 0.155; Major support 0.16; Resistance near 0.16; Major resistance 0.175
- Up: 1h close > 0.16 → 0.1647–0.1679; Down: 1h close < 0.155 → 0.152–0.1489
- Not explicitly stated; framework relies on breakouts of stated trigger levels for confirmation
Forecast range (P50): 0.1583; P20-P80: 0.1485–0.164. The price sits between the defined support and resistance bands, with a downside tilt supported by trend factors and a neutral RSI reading.
Drivers
- FNG Z-SCORE (contrib 1.91 | value 7.38); SPREAD BP (-1.73 | 1.21); LS TOP Z-SCORE (-1.02 | -3.6); STABLE MCAP LOG1P (-0.92 | -2.17); LS GLOBAL Z-SCORE (0.85 | -3.23); GOLD SILVER RATIO Z-SCORE (0.84 | 0.76)
- Very low vol regime; volatility unit 0.0013; ATR 0.0007
- Taker flow shows buy pressure (60.9%); market positioning indicates long crowding (1.38x)
ETF Flows (BTC/ETH)
Contextual signal: ETF flows provided are limited to BTC and ETH and should be considered as macro risk-on/off context rather than direct ADA signals. BTC ETFs show a short-term outflow (-$11.6M) over 1 day, with larger 5- and 10-day declines (-$204.5M, -$598.0M respectively). ETH ETFs show a mixed picture with a 1-day inflow (+$11.7M) and positive longer-term liquidity inflows (5D +$77.5M; 10D +$89.1M).
Overall interpretation: The BTC outflows suggest risk-off pressure in the broader market, while ETH inflows could reflect selective liquidity shifts. Given ADA’s data-rich but asset-specific signals, ETF flow data should not be treated as a primary signal for ADA; instead it provides macro context for risk appetite and liquidity environment.
What to Watch Next
- Monitor 1h close relative to 0.16 and 0.155 trigger levels for potential breakout/inflection signals.
- Observe changes in volatility regime and ATR, which may precede a shift in the TA trend.
- Track BTC ETF flow trends as a proxy for broader risk sentiment rather than direct ADA catalysts.
- Watch for shifts in order-book imbalance (EMA5) as an intraday momentum cue.
Hashtags: #ADA #Cardano #CryptoAnalysis #MarketSnapshot #TechnicalAnalysis #ETFFlows #BTC #ETH #CryptoMarkets