
Market Snapshot
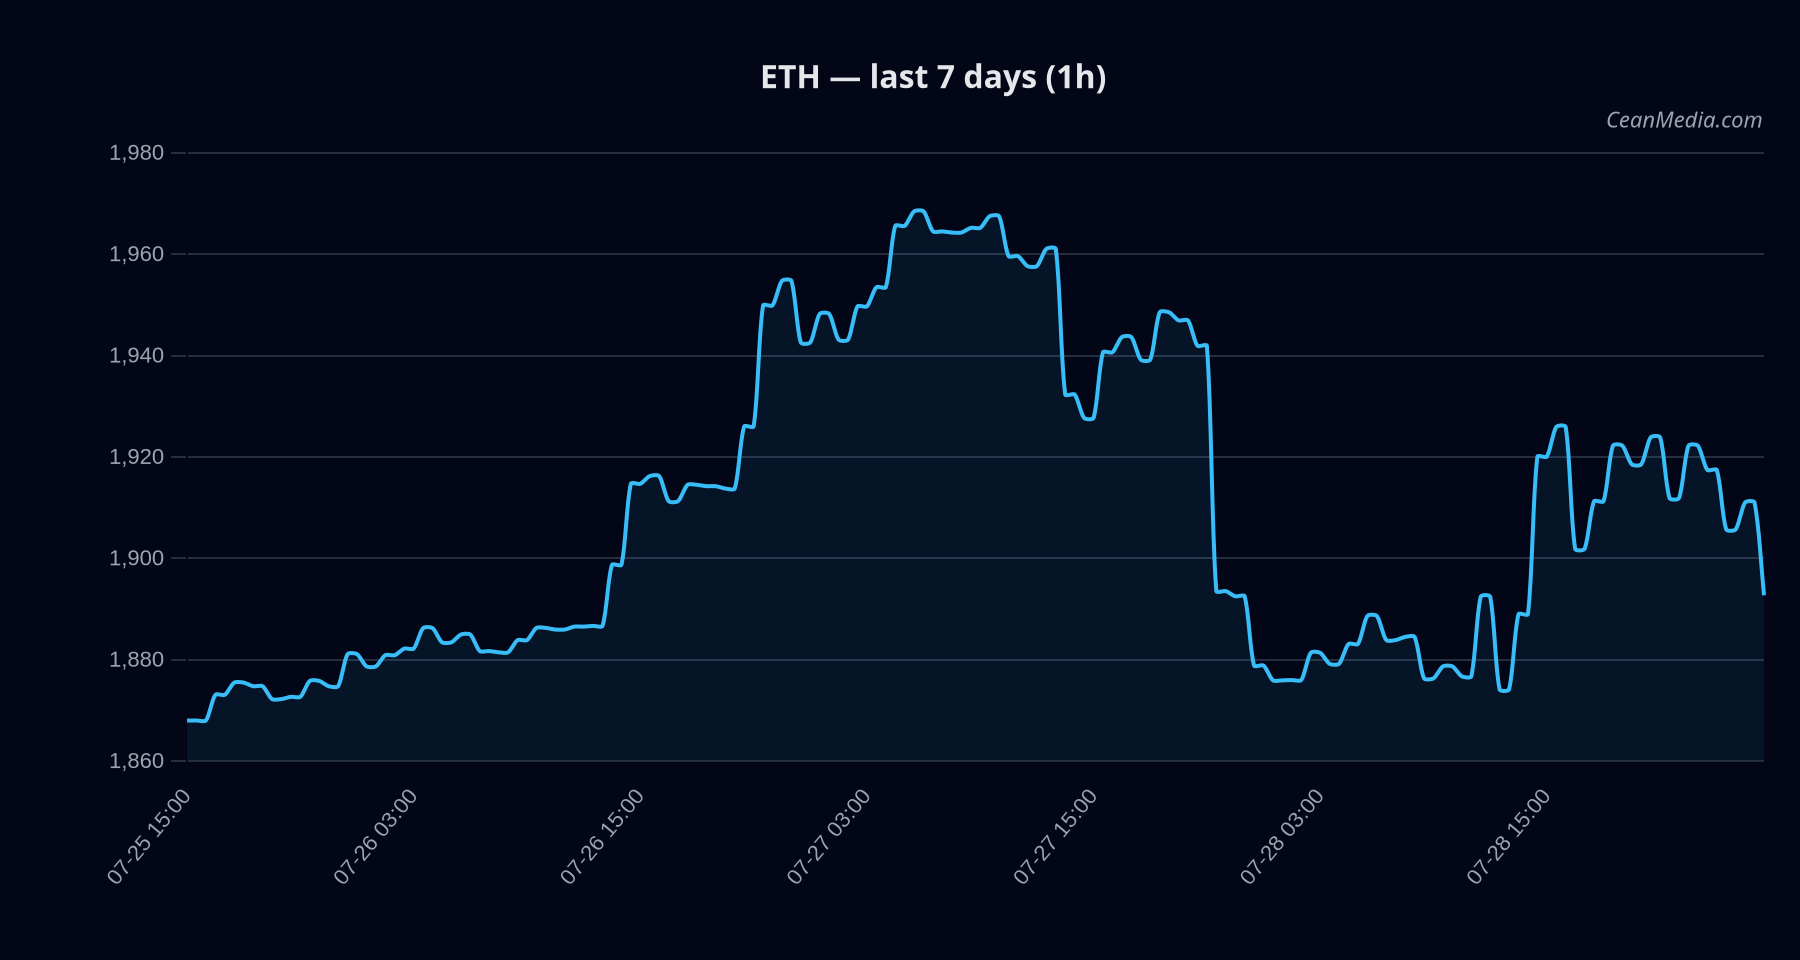
As of 2026-07-29, Ethereum (ETH) trades around the mid-1,800s with a mixed-to-neutral short‑term bias. The price closed at approximately $1,890.48, with a forecast implying a majority probability of upward movement within the next 24 hours but accompanied by notable uncertainty. Overall market breadth remains modest, and volatility is labeled as very low in the current context.
Technical Analysis: ETH
-0.7 with 2 conflicts. Up (54%), with Down 36% and Sideways 10%. Sideways; RSI 44. EMA12>EMA26 and SMA50>SMA200; volatility (σ24h) 0.65%; vol regime: very low. Support near $1,852 and major support at $1,806; Resistance near $1,928 and major resistance at $1,934. $1,891.27; 20th-80th percentile: $1,779.97 – $1,993.56.
Drivers
(contrib/value): - GOLD/SILVER RATIO: 0.79 / 0.74
- FNG Z‑SCORE: -0.74 / 7.3
- RV 7D: 0.26 / -0.84
- DOW RET 1D: -0.25 / 0.43
- STOCK BASKET RET 5D: -0.25 / -0.34
- CRYPTO STOCK BASKET RET 5D: 0.19 / -0.13
Very low volatility regime; breadth modest (17% above SMA50); BTC correlation is high (0.93). RSI neutral at 44; EMA slopes and order-book imbalances suggest modest intra-range pressure.
ETF Flows (BTC/ETH)
ETF flow data presented here covers BTC/ETH only and should be viewed as contextual rather than a primary signal for ETH price action. Over the recent period, BTC ETFs show net outflows on the 1D/5D/10D windows (−$11.6M, −$204.5M, −$598.0M respectively), while ETH ETFs show modest inflows (1D +$11.7M; 5D +$77.5M; 10D +$89.1M). This suggests a relative shift toward ETH positioning in duration-weighted terms but does not imply a direct causal impact on ETH price beyond broader market risk sentiment implications.
1D: −$11.6M; 5D: −$204.5M; 10D: −$598.0M. 1D: +$11.7M; 5D: +$77.5M; 10D: +$89.1M.
What to Watch Next
- Monitor for a close above the resistance cluster near $1,928 to validate upside momentum toward the $1,966–$2,005 range.
- Watch for a break below $1,852 to confirm a potential move toward $1,815–$1,779 in a corrective scenario.
- Observe changes in volatility regime and breadth, as shifts could precede larger directional moves.
- Keep an eye on ETH-specific liquidity and order-book dynamics, given the current very-low volatility context.
Hashtags: #ETH #Ethereum #CryptoTrading #TechnicalAnalysis #ETFFlows #MarketSnapshot #PriceLevels #SupportResistance #MarketMomentum #Liquidity #Volatility
Note: ETF data shown here is BTC/ETH specific and serves as contextual information rather than a decisive ETH signal.