
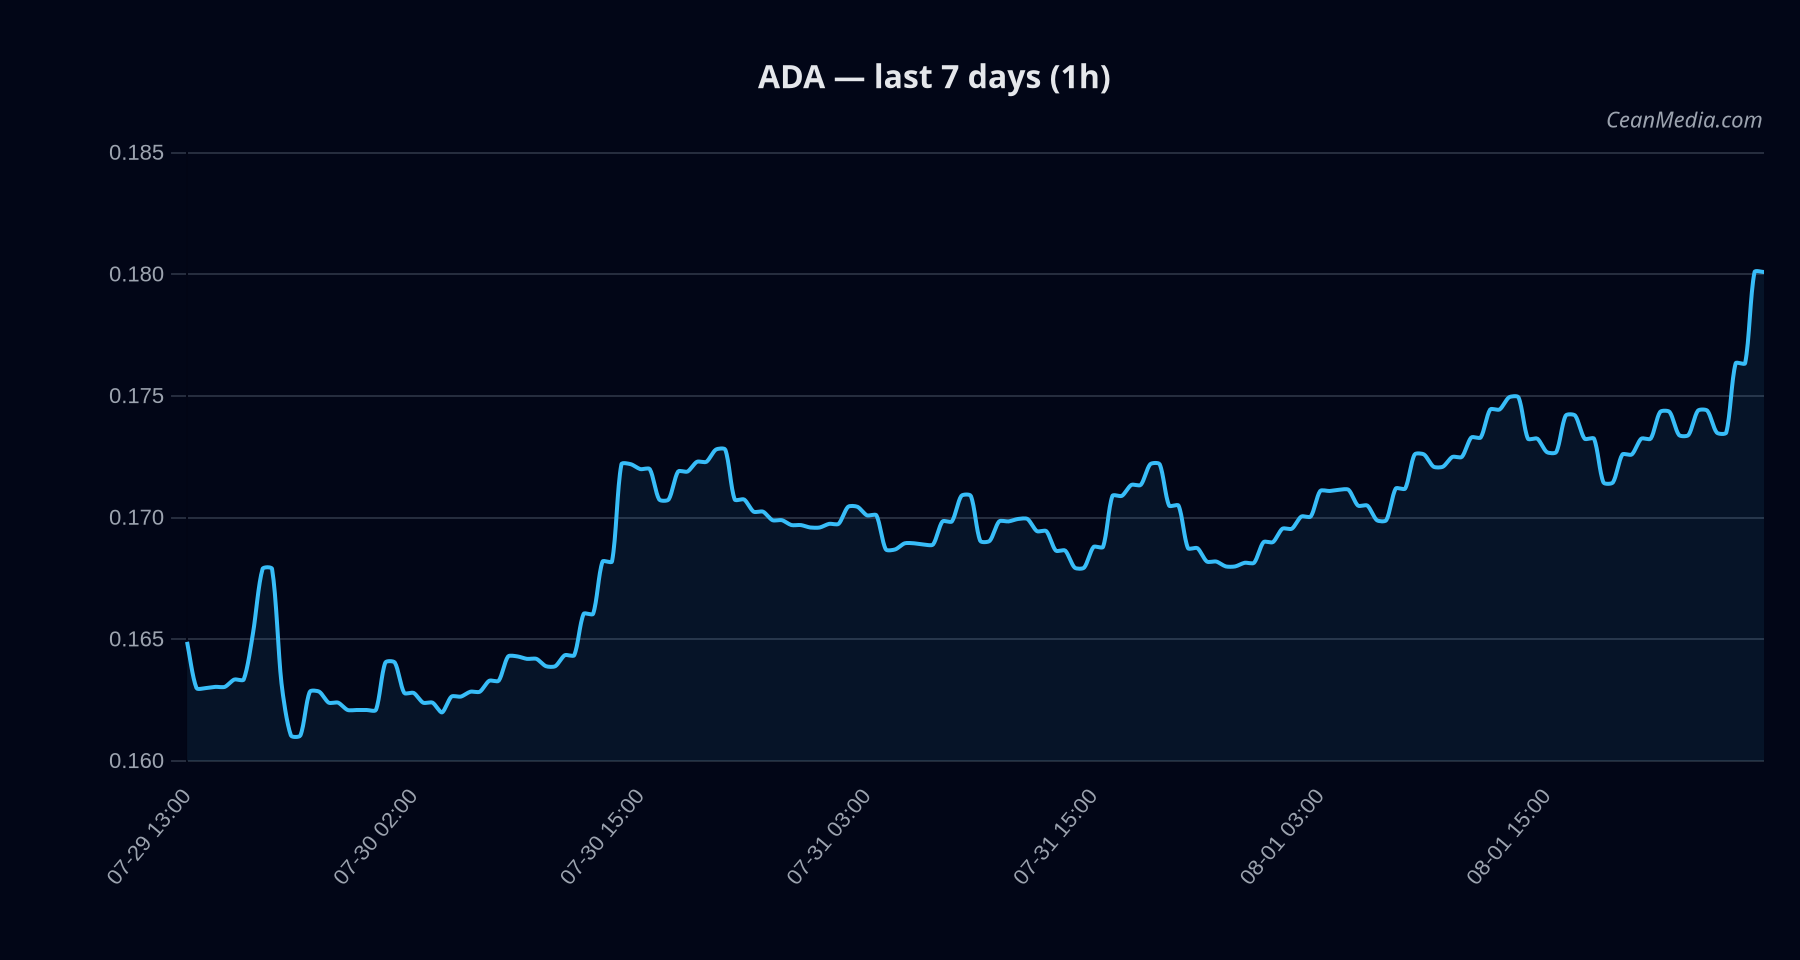
Market Snapshot
Asset: ADA/USD. Close: 0.1804. Timeframe: intraday to 24h horizon. Market breadth remains favorable with 83% of assets above their 50-period moving average, while Bitcoin correlation stands at 0.29. The overarching macro backdrop signals subdued volatility (Very Low vol regime) with a cautious risk stance reflected in sentiment indicators (Fear index ~27).
Technical Analysis: ADA
: +2.4; conflicts 0. : EMA12>EMA26, SMA50>SMA200, RSI 71, σ24h 0.77%, very low volatility regime. - Support near 0.175; major support at 0.16.
- Resistance near 0.185; major resistance at 0.175 (note: major label indicates intra-range dynamics).
: P50 ~0.1786; P20–P80 ~0.1672–0.2008.
Drivers
- Top model drivers (contributions):
- RETURN 24H: +0.06
- EMA SLOPE: +0.0056
- FUNDING Z-SCORE: +0.61
- BASIS Z-SCORE: +0.39
- ORDER-BOOK IMBALANCE (EMA5): +0.0065
- BTC RETURN 24H: +0.006
- Overall momentum: positive signals in trend strength (~1.57) with a distance from MA around +5.4% contributing to a cautious bullish backdrop.
- Volatility regime: Very low; volatility of volatility (vol_of_vol) at ~0.0115 suggests muted swing dynamics.
- Macro/Market context: cross-market risk assets softening; stablecoin liquidity contracting; market fear index around 27.
ETF Flows (BTC/ETH)
Contextual note: ETF flow data shown pertains to BTC and ETH only and is provided for market context, not as a primary signal for ADA trading decisions. BTC ETFs show notable outflows for 1D (-$265.4M), with 5D and 10D also negative, while ETH ETFs display modest inflows (+$9.0M 1D) and larger positive moves over 10D (+$96.3M).
- BTC ETF: 1D -$265.4M | 5D -$244.9M | 10D -$305.5M
- ETH ETF: 1D +$9.0M | 5D -$6.2M | 10D +$96.3M
What to Watch Next
- Watch for a close above 0.185 to confirm a short-term bullish extension toward 0.1877–0.1914.
- Monitor a break below 0.175 for potential acceleration toward 0.1733–0.1697.
- Keep an eye on RSI behavior near the overbought zone to assess risk of a pullback within the prevailing uptrend.
- Assess macro risk signals alongside ETF flow momentum in BTC/ETH as potential secondary indicators for risk appetite shifts.
Hashtags: #ADA #Cardano #CryptoMarket #TechnicalAnalysis #ETFFlows #Bitcoin #Ethereum #BTCETHFlows #MarketSnapshot #TradingStrategy #PriceLevels