
Market Snapshot
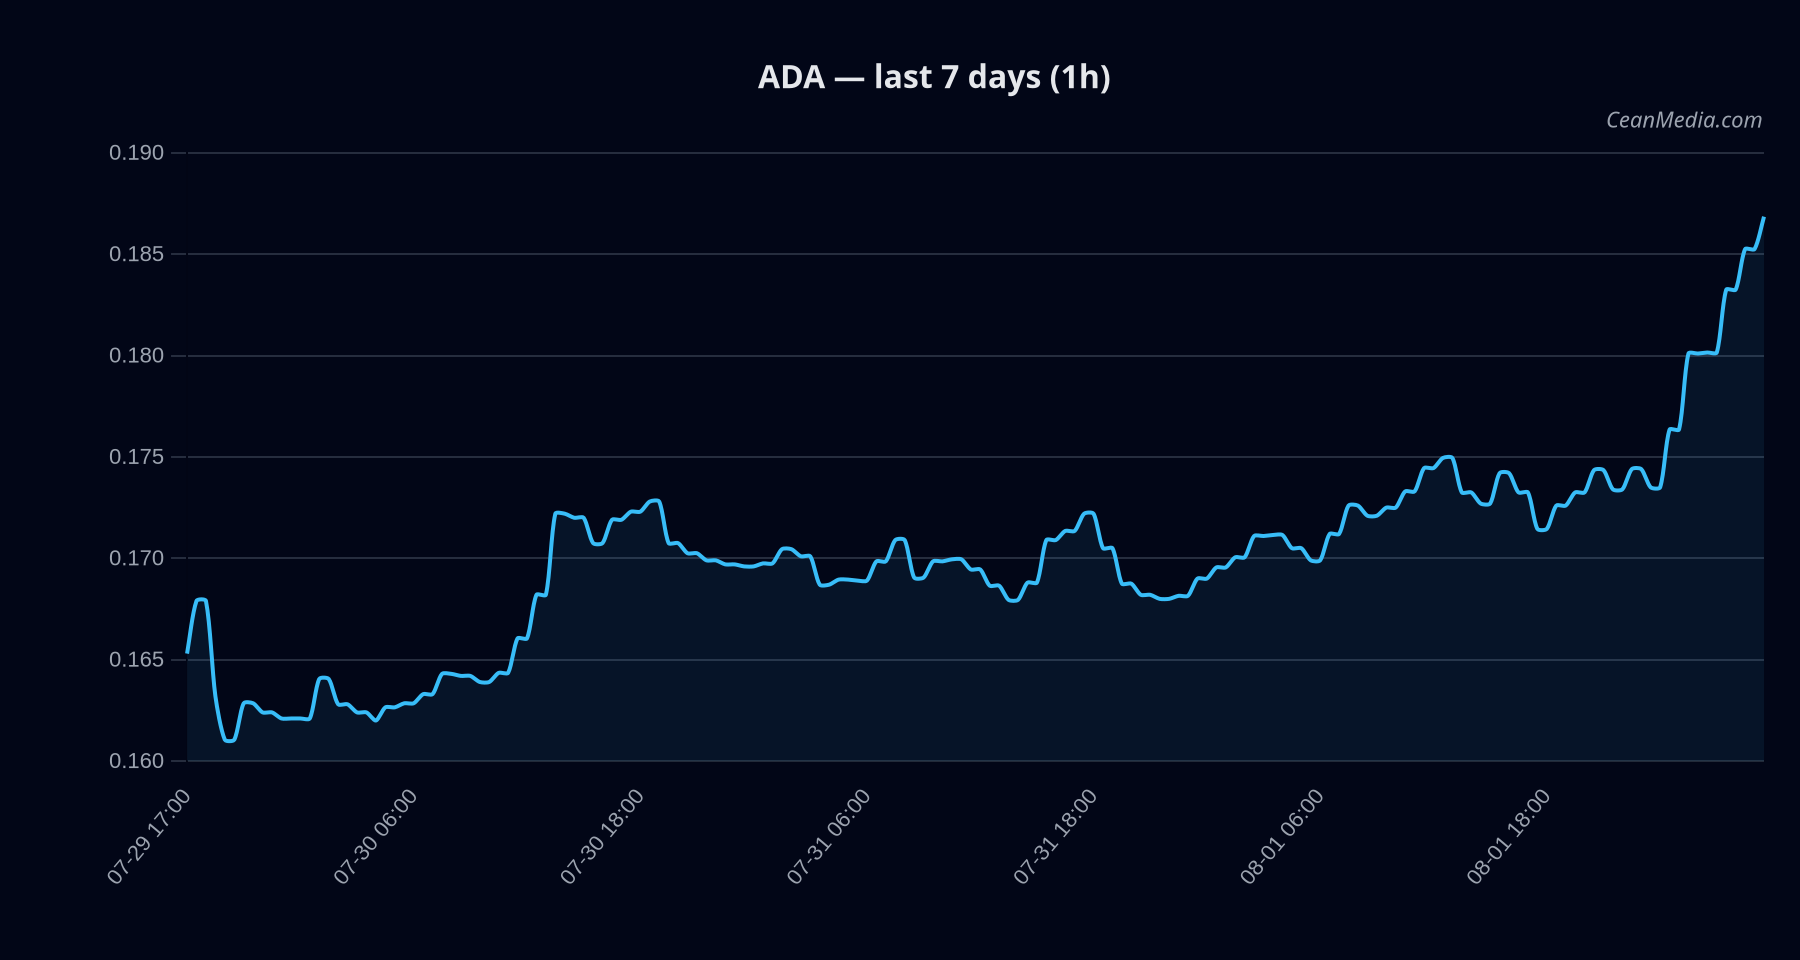
Asset: ADA/USD | Date: 2026-08-02 | Close: 0.1864
- Overall bias: slightly bullish with low certainty (35/100)
- Composite score: +2.4; Data: largely aligned
- Volatility regime: very low; RSI at 80 indicates near-term overbought conditions
Technical Analysis: ADA
Current setup places ADA within a range defined by support near 0.185 and resistance near 0.190. A break above 0.190 targets 0.1939–0.1977, while a break below 0.185 suggests a move toward 0.179–0.1754. The primary TA indicators point to a bullish trend:
- EMA12 > EMA26 and SMA50 > SMA200
- RSI at 80 (overbought territory)
- Volatility: σ24h ~ 0.80%; very low vol regime
Forecast range (P50): 0.1839 with 20th–80th percentile band 0.1745–0.1988. The model signals a downside tilt (probability ~47%) in the near term, with upside ~39% and sideways ~13%.
- Key levels: Support 0.185 (near) / 0.165 (major); Resistance 0.19 (near) / 0.175 (major)
- Trigger for Upside: 1h close > 0.19 -> targets 0.1939 and 0.1977
- Trigger for Downside: 1h close < 0.185 -> targets 0.179 and 0.1754
Invalidation: breakout confirmations are not currently established beyond the stated triggers; the signal remains conditional on price action breaking the defined levels.
Drivers
- Top model drivers: Return 24H, EMA slope, funding Z-score, basis Z-score, order-book imbalance (EMA5), BTC 24H return
- Momentum and volatility context: 100% breadth above SMA50; BTC correlation ~0.27 over 72h; overall risk-on/off sentiment reflected in fear index around 27
- Net takeaway: The TA remains bullish on price structure, while macro/market inputs suggest cautious posture due to risk-off signals
ETF Flows (BTC/ETH)
The provided ETF flow data pertains to BTC and ETH only and should be viewed as contextual for macro risk appetite, not as a primary signal for ADA trading decisions. Recent flows show:
- BTC ETF: -$265.4M (1D); -$244.9M (5D); -$305.5M (10D) — net outflows indicating risk-off sentiment for BTC over the measured windows
- ETH ETF: +$9.0M (1D); -$6.2M (5D); +$96.3M (10D) — mixed signals with a slight positive tilt over 10D
Interpretation: In the current context, ETF activity points to a cautious or risk-off backdrop for BTC, with a nuanced view for ETH. This environment can influence correlated assets and broad market liquidity but is not a primary driver for ADA, which should be interpreted in conjunction with its own technicals and local liquidity conditions.
What to Watch Next
- Monitor for a break above 0.190 to validate near-term upside potential toward 0.1939–0.1977.
- Watch for a break below 0.185 to confirm downside risk toward 0.179–0.1754.
- Observe changes in RSI from overbought territory and any shifts in vol regime or breadth signals.
- Keep an eye on BTC/ETH ETF flow context for any renewed risk-on/off shifts that could impact cross-asset correlations.
Hashtags: #ADA #Cardano #CryptoTrading #TechnicalAnalysis #ETFFlows #MarketSnapshot #CryptoNews #Altcoins #Liquidity #RiskOn #MarketStructure
Note: ETF data shown reflects BTC and ETH only and should be treated as contextual information rather than a primary ADA signal.