
Market Snapshot
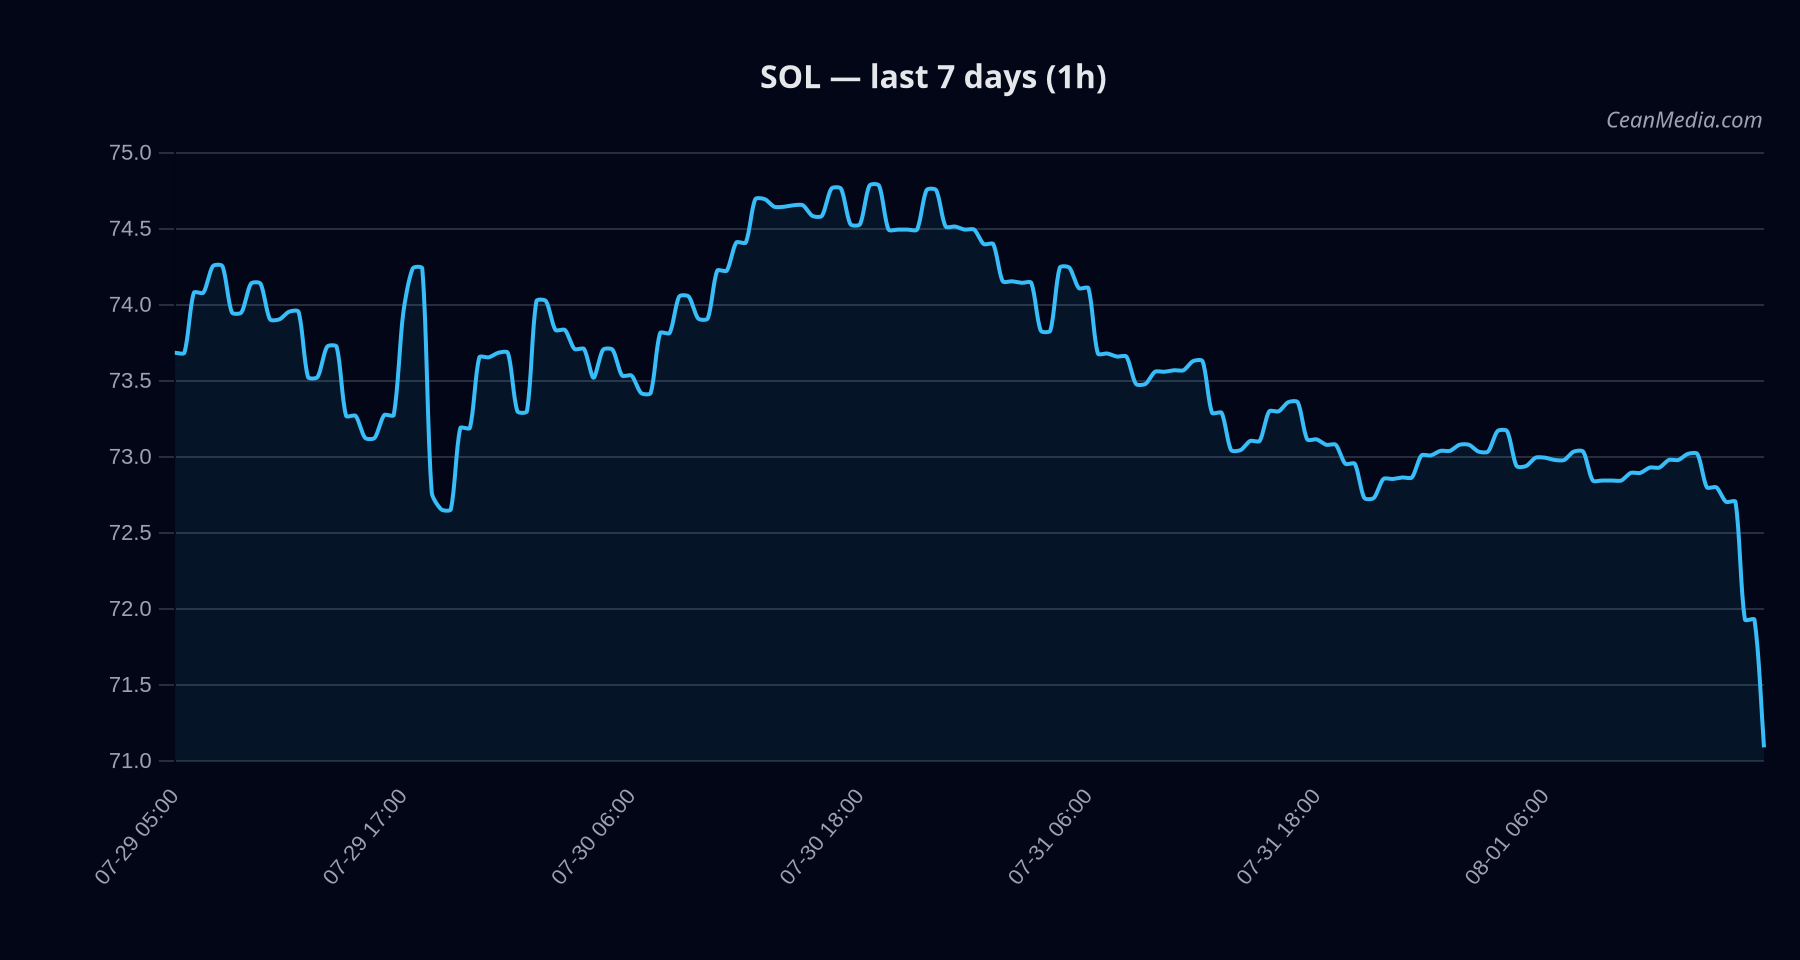
Solana (SOL) trades near the lower end of its short-term range with a bias towardbearish momentum tempered by a very low volatility regime. The model indicates a sideways forecast with a bearish TA backdrop and a currently oversold RSI signal supports potential near-term stabilization if price can hold above key support.
Technical Analysis: SOL
- Price: Close 71.21. Forecast range (P20-P80): 67.71 – 73.20. Support near 69.8; major resistance near 72.6; major resistance at 74.6; major support at 68.39–66.99 if downside action accelerates.
- Bias & Trend: Bearish bias with medium certainty (45/100). TA trend bearish; RSI 17 indicates oversold conditions. EMA12 < EMA26 and SMA50 < SMA200 corroborate the bearish trend, though the vol regime is very low, suggesting limited intra-day swings.
- Traders’ Levels: Up trigger — 1h close above 72.6 targets 74.0869–75.5396. Down trigger — 1h close below 69.8 targets 68.3901–66.9944.
- Forecast: Sideways (9%), with a model forecast leaning toward downside (Down 47%) versus Up 44% and Side 9%.
- Key Signals: RSI oversold; breadth at 17% above SMA50; volatility is very low (ATR 0.1807, vol unit 0.2848). Flow indicators show marginal long pressure with long-liquidations pressure and long crowded positioning dynamics.
- Invalidation Considerations: Break above 74.6 (major resistance) or a break below 66.99 would significantly alter the current narrative and may require re-evaluation of risk targets.
Drivers
- LIQ TO OI Z-SCORE: -0.75 (contrib), value 3.85
- FNG Z-SCORE: -0.59, value 5.48
- LIQ TO OI EMA12: +0.57, value 4.6
- GOLD SILVER RATIO Z-SCORE: +0.39, value 0.64
- SPREAD Z-SCORE: +0.37, value 2.07
- NASDAQ100 RET 1D: +0.28, value 0.15
- Cross-market risk assets appear supportive, but stablecoin liquidity is contracting over 7 days. Fear index sits at 27, reflecting cautious sentiment. ETF exposure data is negative for BTC in the short horizon, which can weigh on risk assets broadly.
- Momentum/Volatility: Very low vol regime suggests limited momentum; RSI oversold implies potential interim rebound if buyers step in near support.
ETF Flows (BTC/ETH)
Note: ETF flow data presented here pertains to BTC and ETH only. These ETF flows provide contextual risk-on/off signals that may influence broad market sentiment but are not primary signals for SOL. As of the latest data:
: 1D -$265.4M; 5D -$244.9M; 10D -$305.5M : 1D +$9.0M; 5D -$6.2M; 10D +$96.3M
Interpretation: The BTC ETF shows net outflows over the 1–10 day windows, suggesting a mild risk-off tilt from BTC-based products. ETH ETF data is mixed with a small 1D inflow but longer-term flows negative or mixed. These signals should be weighed as contextual market pressure rather than direct SOL momentum indicators.
What to Watch Next
- Watch for a daily close above 72.6 to confirm a potential move toward 74.1–75.5 region.
- If SOL breaks below 69.8 on a 1h or daily close, monitor for a potential drop toward 68.4–67.0 or lower levels; reassess risk management.
- Monitor ETF flow signals for BTC/ETH as broad-market context; while not primary SOL signals, sustained BTC outflows could pressure SOL with systemic risk-off tendencies.
- Keep an eye on RSI and volatility regime; an uptick in volatility could precede a more pronounced move if price approaches key levels.
Hashtags: #Solana #SOL #CryptoMarkets #TechnicalAnalysis #ETFFlows #BTC #ETH #MarketSnapshot #RiskManagement #PriceAction