
Market Snapshot
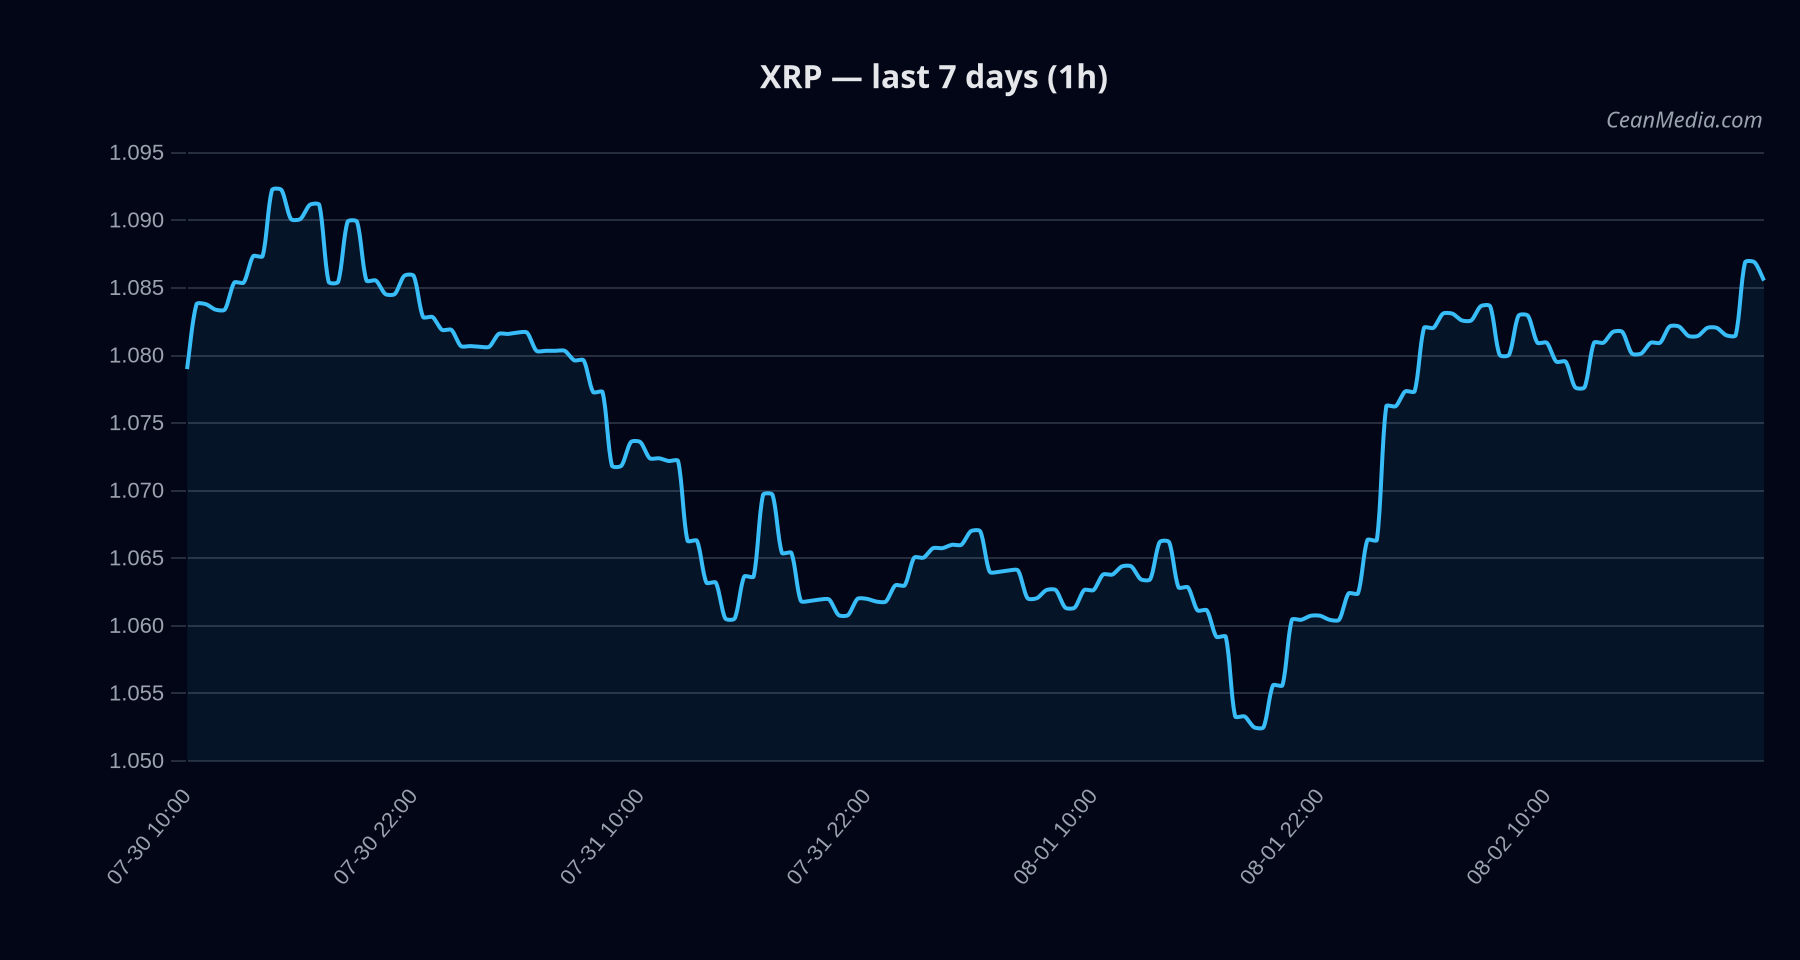
As of 2026-08-02, XRP trades near the key supports and resistances with a bias leaning slightly bullish but overall neutral in the near term. The composite score suggests modest positive tilt, though certainty remains low at 12/100. Market context shows very low volatility and a broad positive breadth signal with BTC correlation at 0.74 over 72 hours.
Technical Analysis: XRP
- Close 1.0848
- Slightly bullish; trend described as sideways (EMA12 > EMA26; SMA50 < SMA200) with RSI at 63.
- TA trend sideways, RSI neutral. Vol regime: Very low; σ24h: 0.27%
-
- Support near 1.06 (major 1.06)
- Resistance near 1.1 (major 1.14)
- P50 1.0797; P20-P80 1.0196–1.16
-
- Up: 1h close > 1.1 → potential move to 1.1286 / 1.1508
- Down: 1h close < 1.06 → potential move to 1.0418 / 1.0206
- Down (48%); Model: mixed with a slight tilt to downside; broader context indicates range-bound dynamics in the near term.
Drivers
- Top model drivers indicate mixed momentum signals: EMA slope supports minor upside; funding Z-score is positive, suggesting funding dynamics are not bearish; order-book imbalance shows minor bullish pressure; BTC 24h return is modestly positive (0.94%).
- Momentum and volatility: Trend strength is moderate, distance from MA is about 1.0%, and 7-day RV is near zero, indicating limited short-term momentum.
- Macro/Market context: Cross-market risk assets are considered supportive; stablecoin liquidity is contracting modestly; market sentiment is in fear territory (F&G at 27).
- Overall posture: The TA framework indicates a sideways range with a slight bearish tilt in the forecast, aligning with the defined support/resistance bands.
ETF Flows (BTC/ETH)
Contextual note: ETF flow data provided pertains only to BTC and ETH and should be interpreted as market-wide liquidity and risk sentiment signals, not direct signals for XRP. The latest snapshot shows:
- BTC ETF: 1D -$265.4M, 5D -$244.9M, 10D -$305.5M
- ETH ETF: 1D +$9.0M, 5D -$6.2M, 10D +$96.3M
The data suggests net outflows from BTC ETFs in the short term with mixed/neutral ETH flows, which can reflect broader risk-off or sector rotation. While XRP is not the primary signal here, sustained ETF outflows from BTC could correlate with periods of risk-off sentiment that may weigh on highly correlated assets, including XRP.
What to Watch Next
- Monitor for a close above 1.1 on the hourly chart to validate upside trigger toward 1.1286–1.1508.
- Watch for a break below 1.06 on the hourly chart to confirm downside path toward 1.0418–1.0206.
- Maintain awareness of broader market risk sentiment and BTC/ETH ETF flows for potential correlation shifts.
- Reassess if volatility regime shifts from Very low to higher levels, which could compress or extend moves beyond current bands.
Hashtags: #XRPAnalysis #CryptoMarkets #TechnicalAnalysis #MarketForecast #ETFFlows #BTCETF #ETHETF #RiskOnOff #PriceLevels #TradingStrategy #CryptoNews