
Market Snapshot
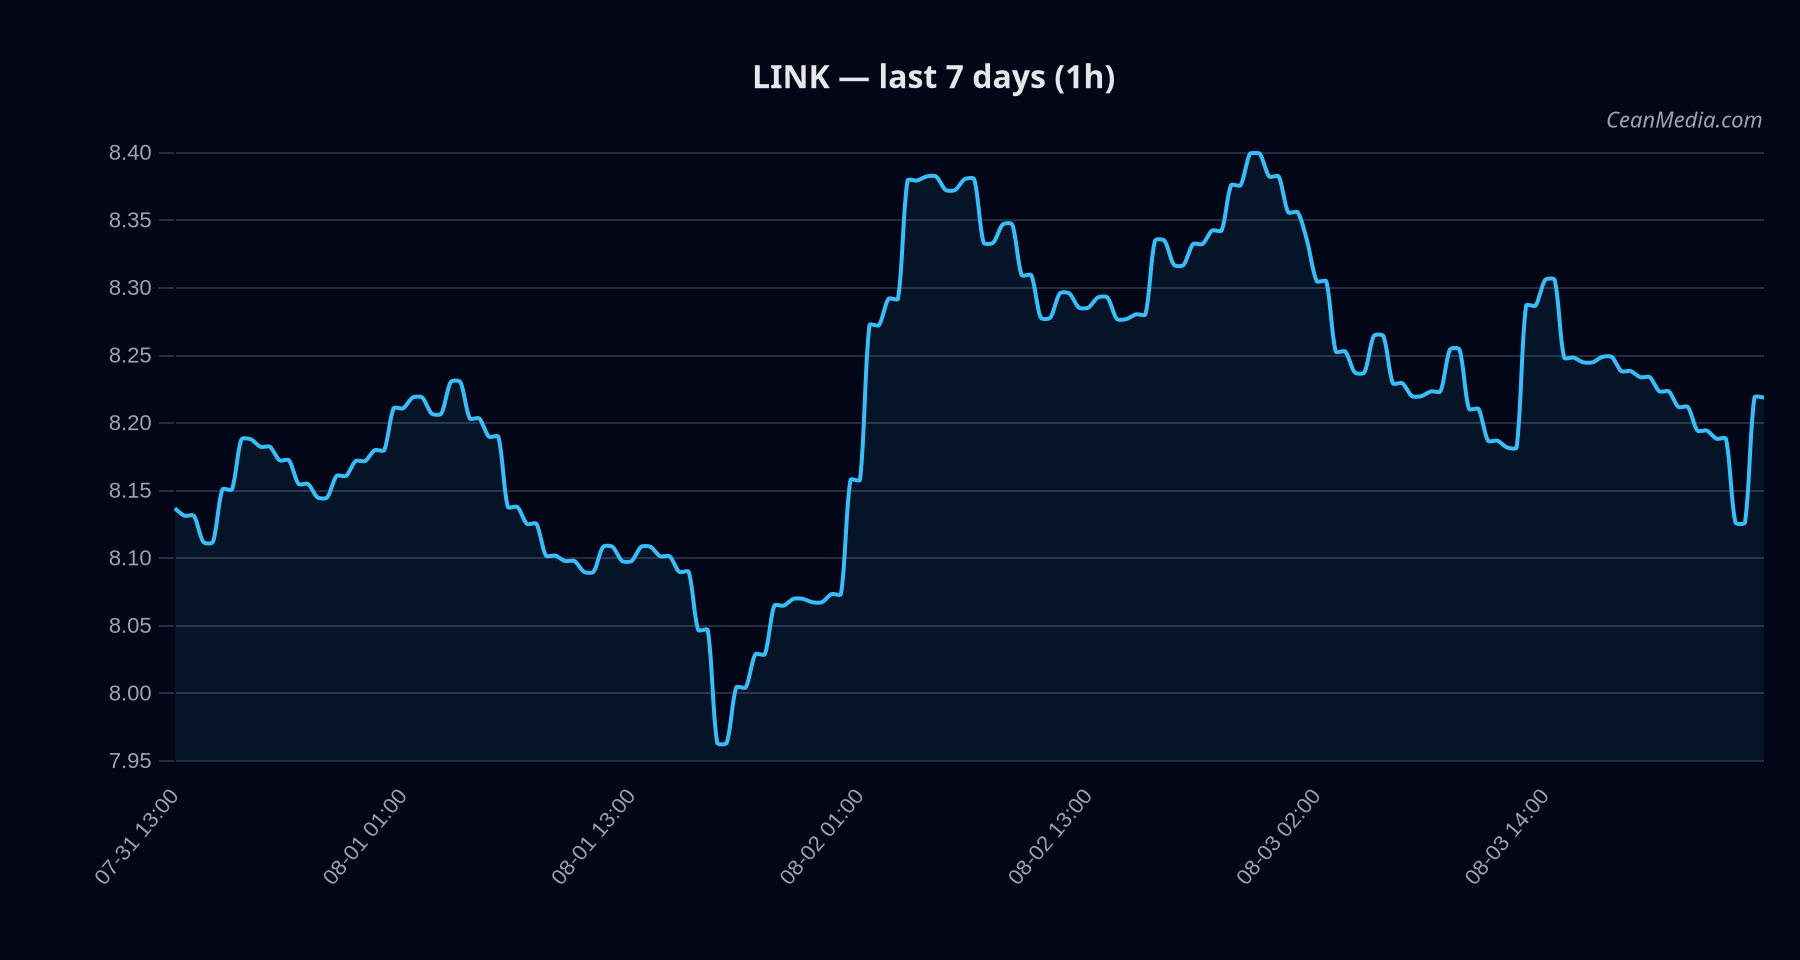
As of 2026-08-04, LINK is trading near the broad support at approximately 8.04 with resistance around 8.36. The current bias is slightly bearish with a low certainty 28/100, and the composite score sits at -2.0. Market breadth remains strong (83% of assets above SMA50), while cross-asset context shows BTC correlation at 0.74 and an overall risk-off sentiment (F&G: 25, Extreme Fear). 24-hour vol is very low, consistent with a quiet trading environment.
Technical Analysis: LINK
8.204 Support near 8.04; Major support implied at 8.2; Resistance near 8.36; Major resistance near 8.66 8.1769; Range (P20-P80): 7.6108 – 8.729 - Up: 1h close > 8.36 → 8.5354 / 8.7028
- Down: 1h close < 8.04 → 7.8791 / 7.7183
Drivers
SP500 RET 1D, SPREAD BP, GOLD/SILVER RATIO, LS GLOBAL Z-SCORE Very low volatility regime; breadth strong (83% above SMA50); BTC correlation 0.74; BTC 24h return ~0.01 EMA slope near-zero, funding and basis z-scores show mixed signals; order-book balance near-neutral yet long-position crowding noted (1.20x). Cross-market risk assets supportive, stablecoin liquidity contracting slightly; sentiment shows Extreme Fear (25).
ETF Flows (BTC/ETH)
Context note: ETF flow data shown here pertains only to BTC and ETH ETFs and is provided for market context, not as a primary signal for LINK. The data may reflect broader risk-on/off dynamics but should not be interpreted as a direct driver for LINK price action.
1D -$265.4M; 5D -$244.9M; 10D -$305.5M 1D +$9.0M; 5D -$6.2M; 10D +$96.3M
The BTC ETF shows net outflows over 1–10 days, which can reflect a risk-off tilt in larger markets. ETH ETF shows a modest 1D inflow against a broader 5–10D flow backdrop. While informative for market context, these ETF flows should not be used as a primary signal for LINK trading decisions.
What to Watch Next
- Monitor 1h closes around 8.36 for potential upside triggers toward 8.5354 / 8.7028.
- Watch for a break below 8.04 to validate downside targets toward 7.8791 / 7.7183.
- Observe any shift in breadth or a notable change in BTC correlation that could precede a regime change in LINK momentum.
- Keep an eye on market sentiment and volatility; a pickup in vol or a capitulative move could alter the current bearish tilt.
Hashtags: #crypto #LINK #technicalanalysis #marketcontext #etfflow #riskassets #trading Signals #priceaction