
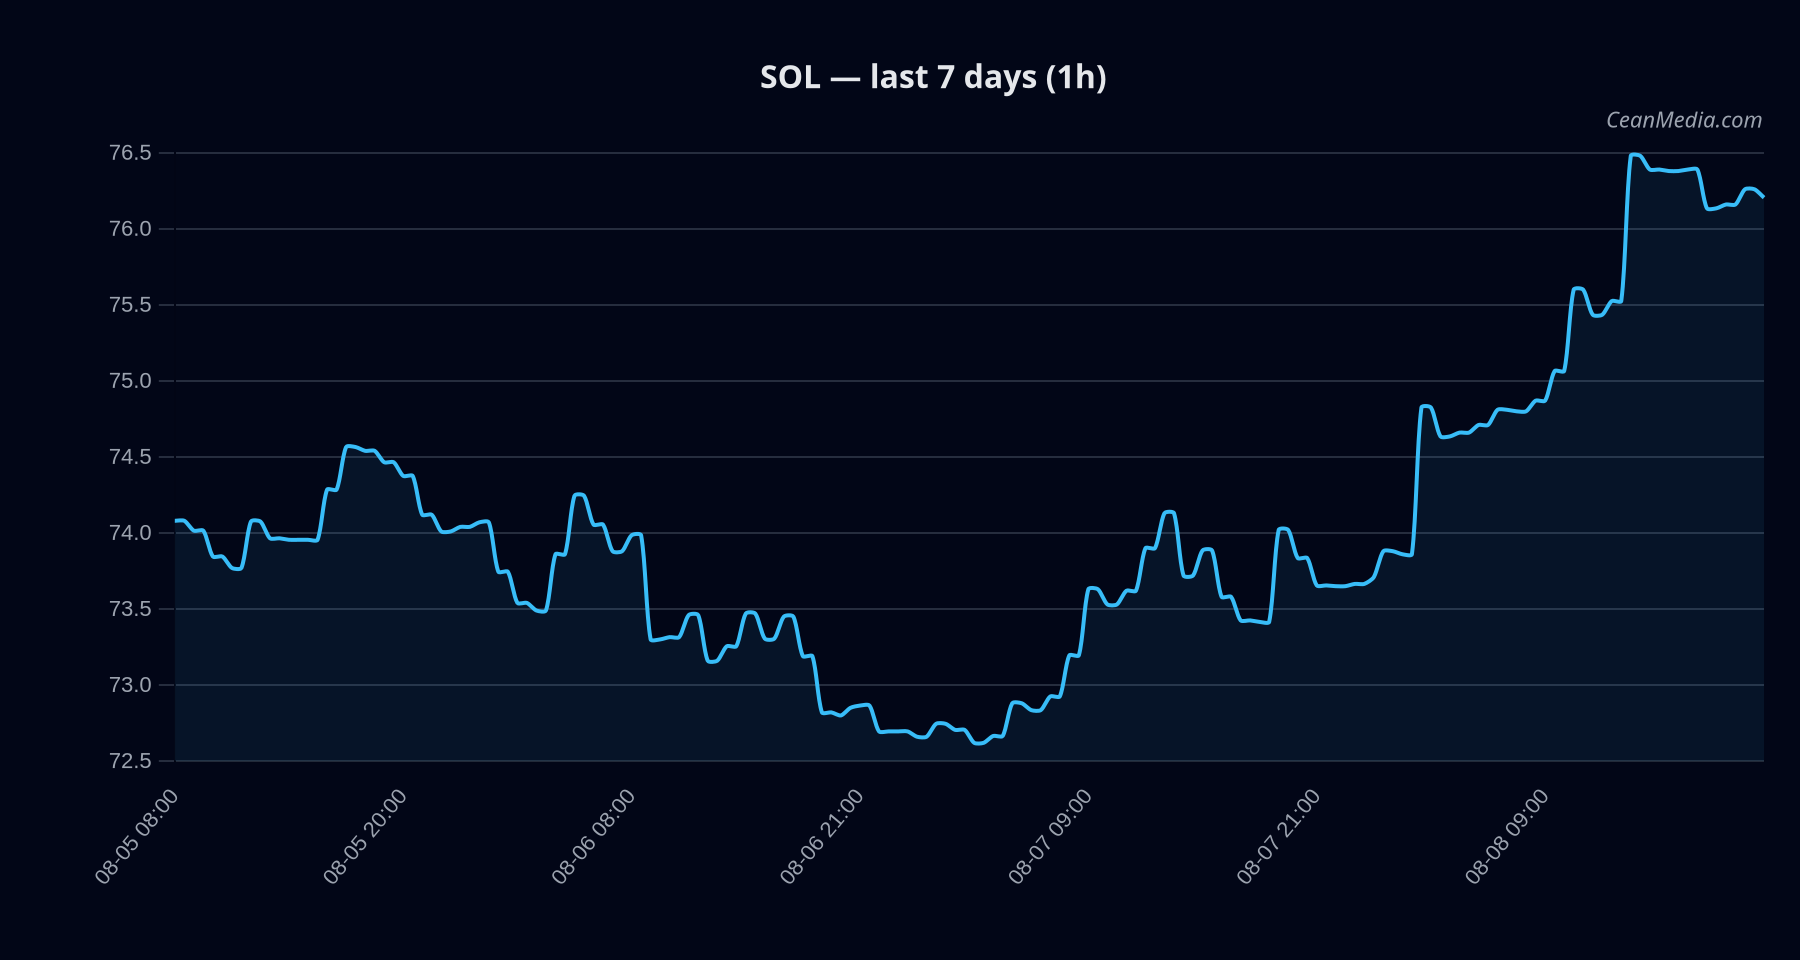
Market Snapshot
The SOL market on the date of 2026-08-09 presents a slightly bullish bias with low certainty (20–30/100) and a composite score of +2.1. The immediate price is near 76.25, with the 24h volatil ity characterized as very low (σ24h 0.39%) and a price range indicating consolidation between defined support and resistance levels.
Technical Analysis: SOL
- Bias: slightly bullish; within a horizontal range anchored by support near 74.7 and resistance near 77.8. Breakouts beyond these levels imply directional moves.
- Close around 76.25.
- EMA12 > EMA26; SMA50 > SMA200; RSI at 73 indicating ‘overbought’ conditions on a short-term basis. Volatility regime is very low (vol regime: Very low).
- Forecast is sideways (~15% probability), with P50 target at 76.88 and P20–P80 at 72.36–80.26. Upward-trigger: close > 77.8 points toward 79.33–80.89. Downward-trigger: close < 74.7 points toward 73.23–71.74.
- Support near 74.7; major support near 72.9. Resistance near 77.8; major resistance near 76.0.
- Up trigger at 1h close above 77.8; Down trigger at 1h close below 74.7. Invalidation remains as long as price stays within the 74.7–77.8 range without a breakout.
Drivers
- Returning 24h at 0.03; EMA slope modestly positive; funding z-score near 0.90; basis z-score near 1.91; order-book imbalance (EMA5) modest; BTC 24h return ~0.0013.
- Overall momentum indicators point to a cautious upward bias, with relatively low intraday volatility; breadth is 83% above SMA50, indicating healthy breadth while BTC dominance trend is positive (+0.41 over 7D). Fear index around 30.
- Cross-market risk assets appear supportive; BTC-dominance trending higher over 7 days supports a risk-on backdrop, though overall volatility remains subdued.
ETF Flows (BTC/ETH)
- 1D +$101.7M; 5D +$865.3M; 10D +$620.4M
- 1D +$49.6M; 5D +$243.7M; 10D +$237.5M
Note: ETF flow data presented here pertains to BTC and ETH ETFs only and should be considered contextual information. It is not the primary signal for SOL price action.
What to Watch Next
- Monitor for a close above 77.8 to confirm a potential upside extension toward 79.33–80.89.
- Watch for a close below 74.7 to confirm a downside extension toward 73.23–71.74.
- Observe changes in RSI and volatility regime (vol regime remains very low) for potential shift in momentum.
- Track BTC dominance and ETF flow momentum as secondary context, given their historical correlation with risk assets.
Hashtags: #sol #solana #cryptotrading #technicalanalysis #marketwatch #etfflows #btc #eth #riskon #volatility #liquidity #blockchain