
Market Snapshot
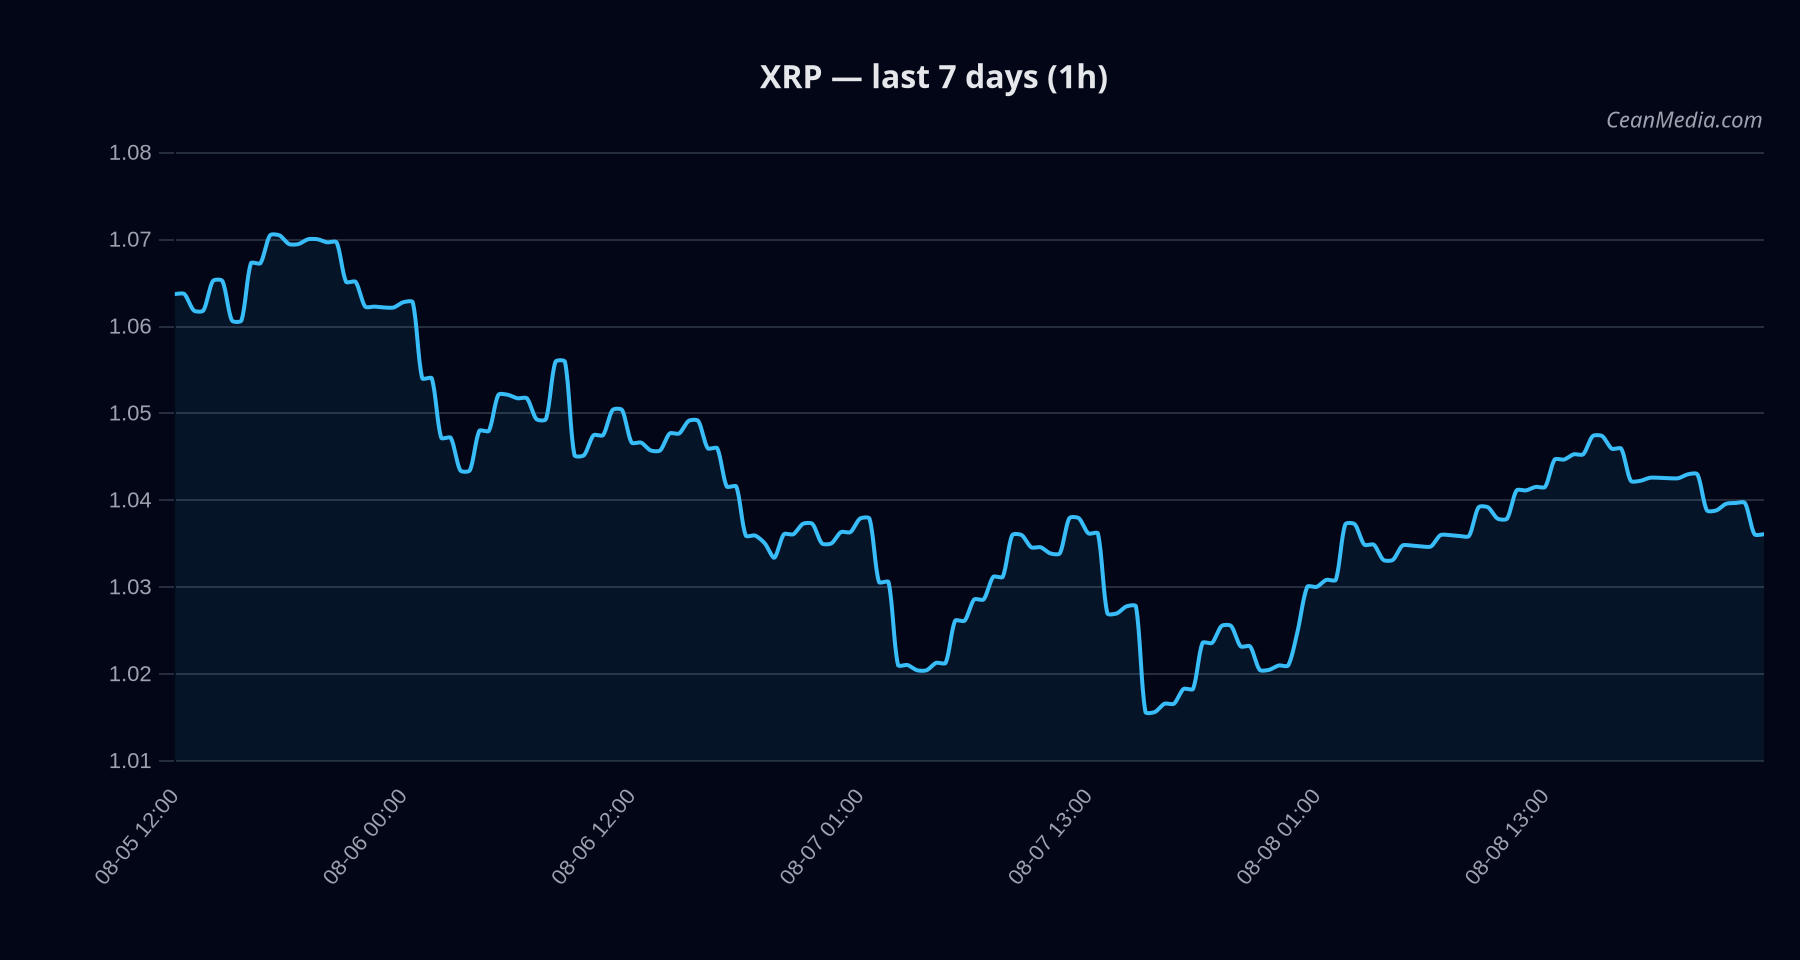
As of 2026-08-09, XRP trades with a close near 1.0348 USD in a path that is described as sideways with a slightly bearish bias. The composite score is negative (-0.8) and certainty is low (12/100). Market breadth is mixed but generally in the middle range (50% above SMA50), and BTC dominance shows a modest positive signal over the past week. Overall risk sentiment is neutral-to-cautious with very low volatility observed in recent sessions.
Technical Analysis: XRP
-0.8 1.0348 EMA12 > EMA26, SMA50 < SMA200, σ24h 0.24%, Vol regime: Very low
1.04 0.9942 – 1.0691
- Up: 1h close > 1.06 → potential move toward 1.0766–1.0977
- Down: 1h close < 1.02 → potential move toward 0.9938–0.9735
Invalidation considerations: Breaks beyond the defined support/resistance levels provide a reference for risk off/on scenarios but do not indicate a guaranteed breakout. The current context notes a slightly bearish stance with an overall sideways price action.
Drivers
NASDAQ100 5D return, FNG Z-SCORE, SPREAD BP, SP500 5D return, RV 7D, STABLE MCAP LOG1P Very low vol regime; RSI around neutral; BTC-dominance trend modestly positive; fear gauge (F&G) at 31 indicating moderate risk aversion 24h return ~0.60%, EMA slope negative, funding and basis Z-scores positive, order-book imbalance small but positive
Net takeaway: The XRP picture is influenced by a mix of technical sideways conditions with a slight tilt toward downside, supported by low volatility and a cautiously risk-off macro tone.
ETF Flows (BTC/ETH)
The included ETF flow data reflects BTC and ETH ETF activity and is provided for market context. It is not a primary signal for XRP pricing. Recent data shows:
- BTC ETF: daily +$101.7M; 5D +$865.3M; 10D +$620.4M
- ETH ETF: daily +$49.6M; 5D +$243.7M; 10D +$237.5M
Interpretation: Sustained inflows into BTC and ETH ETFs generally reflect risk-on appetite in broader crypto markets. While this context can support market liquidity and correlations, XRP-specific decisions remain driven by XRP-specific indicators and external catalysts. The ETF data should be treated as contextual information rather than a standalone signal for XRP direction.
What to Watch Next
- Watch for a close above 1.06 on an hourly basis to confirm potential upside targets toward 1.0766–1.0977.
- Monitor a break below 1.02 for potential move toward 0.9938–0.9735, which would shift momentum more firmly bearish.
- Keep an eye on liquidity and vol regime: very low volatility can precede larger moves if triggered by macro news or market flows.
- Assess correlation with BTC/USD moves as BTC dominance trends and ETF flows evolve, given cross-asset risk sentiment shifts.
Hashtags: XRP, XRPUSD, crypto, technical-analysis, market-analysis, ETF-flows, BTC, ETH, risk-on, risk-off, volatility