
Market Snapshot
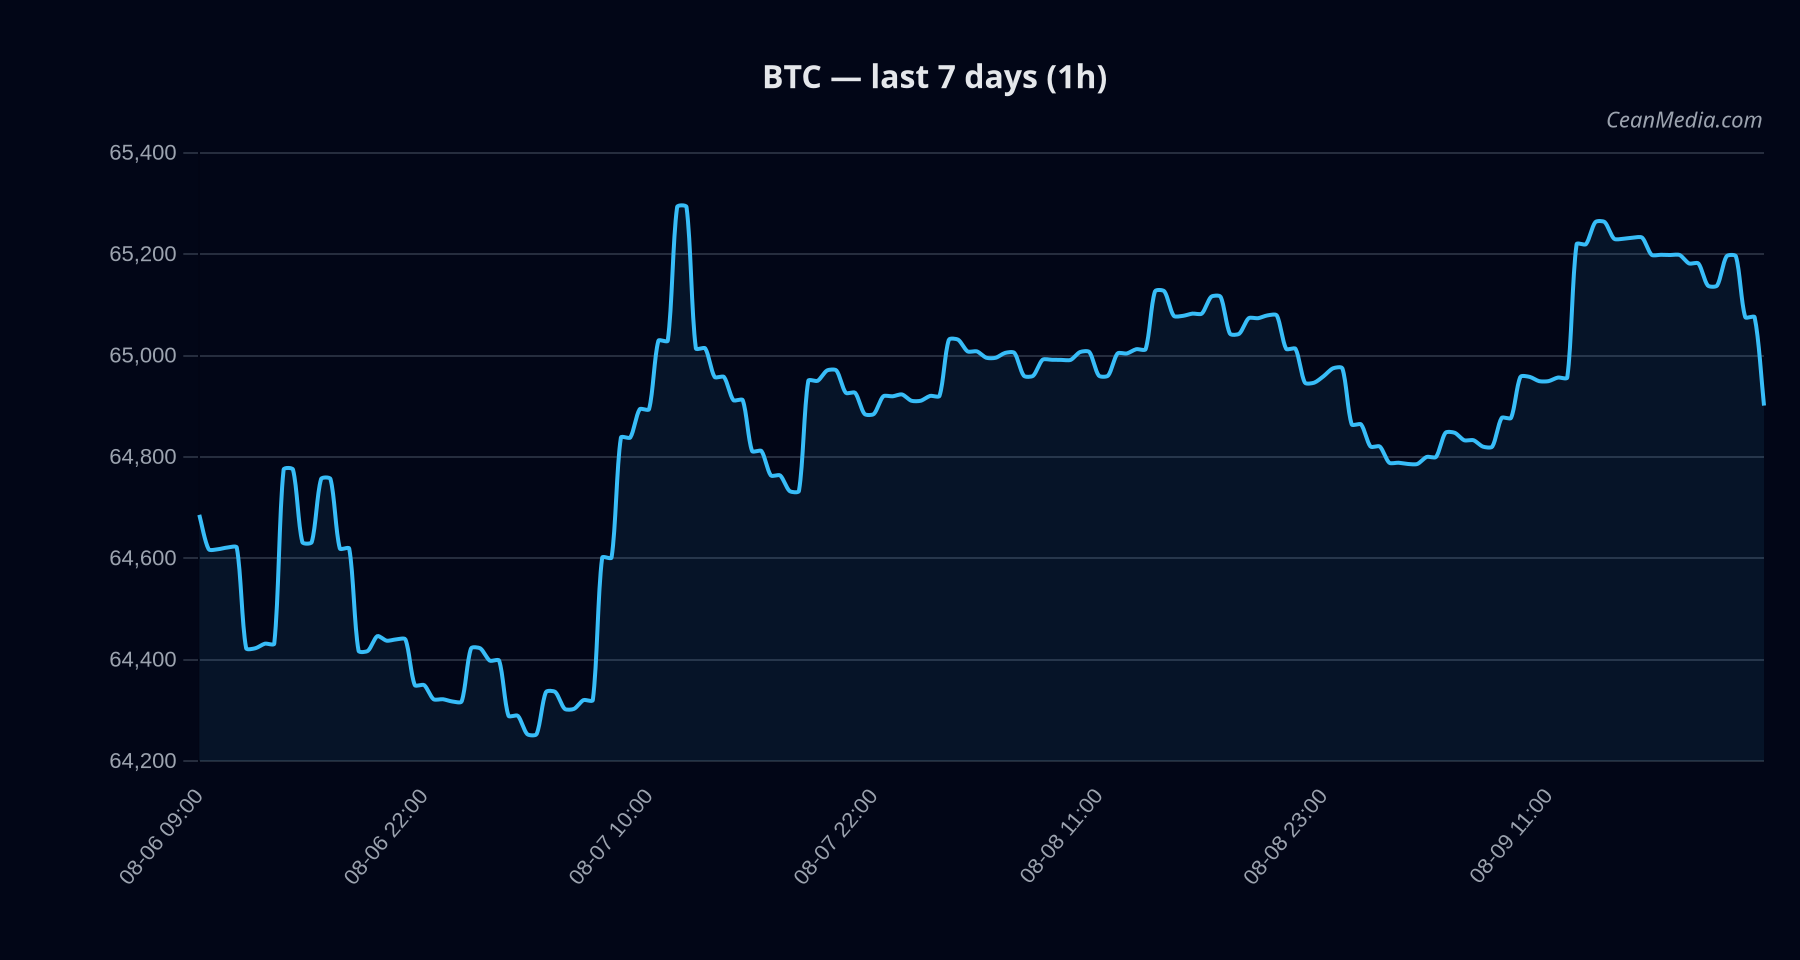
Bitcoin (BTC) is positioned in a bullish context as of 2026-08-10, with a price near 65,229 USD. Market breadth remains robust (67% above the 50-day SMA) and correlation to BTC/USD is elevated (0.99–1.00 range in short spans). Overall sentiment is cautious, with a Fear index around 30, and cross-market signals showing risk assets supportive. Intraday volatility is currently very low, reflected in narrow price action and a tight ATR.
Technical Analysis: BTC
- Bullish bias with a composite score of +2.8. TA trend is bullish (EMA12>EMA26, SMA50>SMA200, RSI 61). Volatility regime is very low (σ24h 0.12%), indicating limited short-term swings.
- Close at 65,229.44; within a defined range with resistance near 66,525 and support near 63,925.
- RSI at 61 (neutral within bullish trend); breadth indicates momentum with 67% of prices above SMA50. Market context shows cross-asset risk assets supportive.
- Support around 63,925 (major 63,075); Resistance around 66,525 (major 65,025).
- Up trigger: close above 66,525 would imply potential move toward 67,864.71–69,195.39. Down trigger: close below 63,925 targets 62,646.35–61,367.86.
- If price breaks decisively below 63,075, the near-term bullish thesis could be reconsidered; follow-through below this major level would weaken the current setup.
- 24h forecast indicates a 48% probability of upward movement, with a 34% probability of downside and 18% sideways. The price range (P20–P80) spans roughly 63,498 to 65,489.
Drivers
- Return over 24h slightly negative; EMA slope negative but marginal; Funding Z-Score positive (1.51) suggesting supportive funding conditions; Basis Z-Score negative; Order-book imbalance modestly negative; BTC 24h return negative.
- BTC vol regime is very low, with low realized volatility reinforcing a cautious, grind-or-break dynamic. The 7D RV is modest, while the trend strength metric remains positive but not extreme.
- Cross-market risk assets show supportive signals; the 5D SP500 return metric is modestly positive, contributing to the constructive backdrop.
- BTC dominance trend shows a slight positive tilt over 7 days, reinforcing relative strength in BTC vs altcoins in the short term.
ETF Flows (BTC/ETH)
ETF flow data for BTC and ETH provides contextual market activity and potential liquidity cues. Current data shows BTC ETF inflows (1D: +$101.7M; 5D: +$865.3M; 10D: +$620.4M) and ETH ETF inflows (1D: +$49.6M; 5D: +$243.7M; 10D: +$237.5M). This information is labeled as context and is not a primary signal for BTC price action. While positive ETF flows can indicate improving demand and liquidity, they should be interpreted alongside price action and other market signals rather than used as a standalone trigger.
What to Watch Next
- Monitor a close above 66,525 to confirm a potential push toward 67,864.71–69,195.39; otherwise remain within the current range.
- Watch for a break below 63,925; if realized with momentum, targets 62,646.35–61,367.86 and could signal a shift in near-term bias.
- Track ETF flow dynamics for BTC and ETH as supplementary context, noting that they are not primary signals for BTC timing.
- Maintain awareness of volatility regime; continued very low volatility may precede a breakout if triggers are hit.
Hashtags: #BTC #Bitcoin #MarketUpdate #TechnicalAnalysis #ETFFlows #CryptoNews #PriceAction #CryptoMarkets #MarketSentiment #Liquidity #TradingStrategy