
Market Snapshot
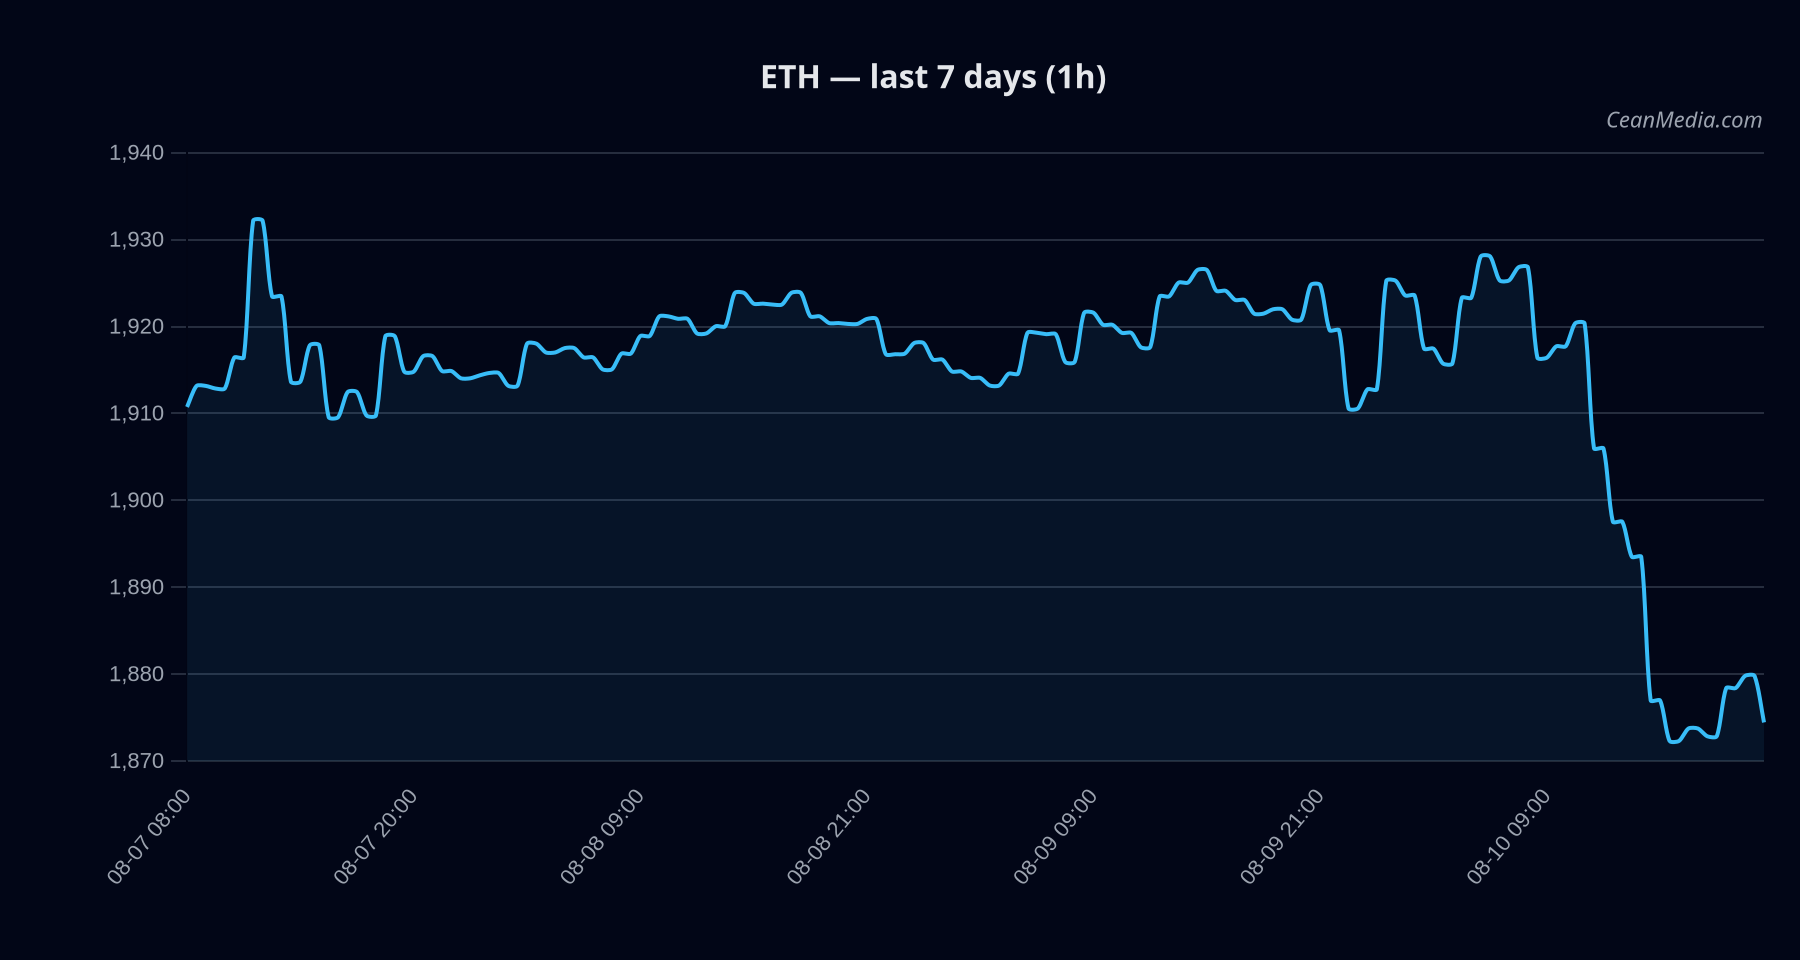
Ethereum (ETH) sits near key support and resistance levels with a mixed, low-conviction setup as of the latest close around 1,874.27. The composite view indicates a neutral bias with a low confidence score, reflecting data that is not fully aligned. The market context shows very low volatility and a BTC-ETH correlation around 0.85, suggesting that cross-asset factors and risk sentiment are influencing positioning, but not driving a decisive directional breakout at this time.
Technical Analysis: ETH
Mixed / neutral; certainty low (5/100). -0.2 with two conflicts. 1,874.27 - Model Forecast: Up (52% probabilistic)
- Up 52% | Sideways 17% | Down 31%
- TA Trend: Sideways; RSI 29 (oversold).
- Key Indicators: EMA12 < EMA26; SMA50 > SMA200; Volatility regime: Very low; σ24h: 0.35%
- Levels:
- Support near 1,836; Major support at 1,862
- Resistance near 1,912; Major resistance at 1,924
1,882.52 / 1,828.15–1,902.34 - Up: 1h close > 1,912 → 1,949.99 – 1,988.23
- Down: 1h close < 1,836 → 1,800.05 – 1,763.31
Market breadth is weak (0% above SMA50), and the BTC correlation remains elevated at 0.85, indicating Bitcoin-driven risk-on/off dynamics may be influencing ETH moves in the near term.
Drivers
VIX Z-score (-0.67), Stable MCAP log1p (-0.58), Gold/Silver ratio (+0.50), RV 7D (+0.45), VIX level (+0.44), LS Top Z-score (+0.32). Very low vol regime; RSI in oversold territory (29). Distance from moving averages modest; distance metric shows a slight undercurrent relative to major averages.
ETF Flows (BTC/ETH)
The ETF flow data provided covers BTC and ETH and is intended to provide market-context rather than a primary signal for ETH price direction. Recent figures show BTC ETFs with stronger net flows than ETH ETFs over the last 5–10 days, suggesting a broader risk-on tilt in the crypto ecosystem, but ETH-specific inflows remain positive (ETH ETF +$49.6M 1D; +$243.7M 5D; +$237.5M 10D). This context indicates supportive demand from institutional holders but should not be interpreted as a standalone ETH bullish signal.
What to Watch Next
- Watch for a 1-hour close above 1,912 to re-activate the upside target near 1,949.99–1,988.23.
- Monitor a break below 1,836 for potential downside extension toward 1,800.05–1,763.31.
- Observe shifts in ETF flow momentum, especially ETH ETF 5D/10D inflows, for incremental demand trends.
- Keep an eye on BTC-relative moves and overall risk sentiment as drivers of cross-asset correlation.
Hashtags: #ETH #Ethereum #CryptoMarkets #TechnicalAnalysis #ETFFlows #CryptoTrading #MarketSnapshot #RiskOn #Volatility #BTC #Altcoins #PriceAction