
Market Snapshot
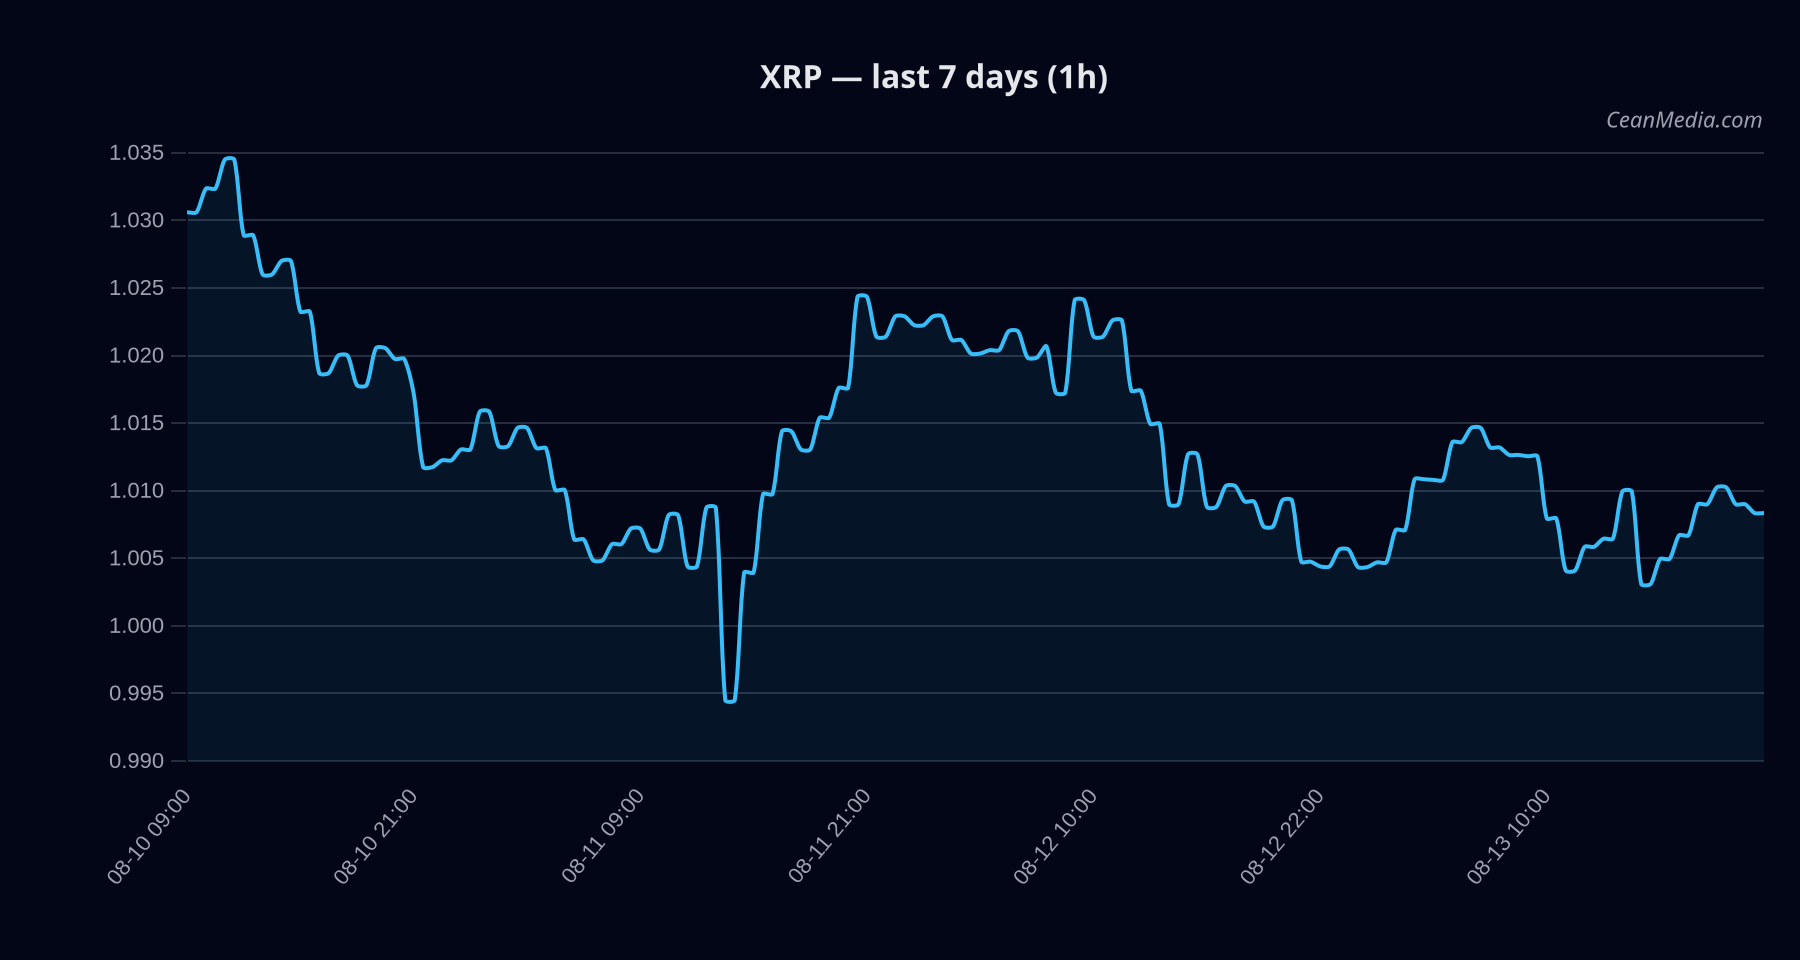
As of 2026-08-13, XRP trades around the 1.00 level with near-term resistance at 1.02 and support near 0.99. The market environment is characterized by very low volatility and a cautious tone amid mixed flows and a fear-driven sentiment backdrop. BTC and ETH ETF flows show net outflows for BTC on the short horizon, with contrasting inflows for ETH over longer windows, providing contextual pressure but not a primary signal for XRP pricing.
Technical Analysis: XRP
- slightly bearish (certainty low at 16/100).
- 1.0093.
- Model forecast: Down (49%), with Up 37% and Side 13%.
- Technical Trend: Bearish. Indicators: EMA12
- Level Setup: Price sits between support near 0.99 and resistance near 1.02. Significant breakpoints:
- Upbreak: close > 1.02 targets 1.0501–1.0707.
- Downbreak: close < 0.99 targets 0.9693–0.9495.
- Forecast Range: P50 at 1.0024; P20–P80 range 0.9603–1.0562.
- Trends & Triggers: Up trigger: 1h close > 1.02 (target 1.0501/1.0707). Down trigger: 1h close < 0.99 (target 0.9693/0.9495).
- Invalidation: Not explicitly specified; ongoing confirmation required via trigger levels.
- Level Setup: Price sits between support near 0.99 and resistance near 1.02. Significant breakpoints:
Drivers
- Stable MCAP log1p contribution (+0.81), Spread (BP) (-0.8), RV 7D (-0.66), Vol of Vol (+0.32), VIX Z-Score (+0.32), FNG Z-Score (+0.27).
- Momentum/Volatility: Market breadth ~33% above SMA50; volatility regime described as very low; BTC dominance trend mildly negative over 7D.
- Flow dynamics: Taker buy pressure (36.5%) with long positioning; overall net tilt toward bearish parameters in model components.
- Don’t over-interpret: ETF data context is separate from XRP-specific signals; fundamentals from XRP-specific TA remain the primary driver for this view.
ETF Flows (BTC/ETH)
ETF flows shown are BTC/ETH only and should be interpreted as contextual market sentiment rather than a direct signal for XRP. BTC ETF shows a 1D net outflow (-$61.1M) but a positive 5D and 10D net inflow, while ETH ETF shows consistent inflows over 5D and 10D windows. These patterns can reflect risk-on/off appetite and institutional positioning in the broader crypto market but do not dictate XRP price action.
- BTC ETF: 1D -$61.1M; 5D +$95.0M; 10D +$505.3M
- ETH ETF: 1D +$7.4M; 5D +$152.7M; 10D +$260.3M
What to Watch Next
- Watch for a clear close above 1.02 to confirm an upside extension toward 1.0501–1.0707.
- Monitor for a close below 0.99 to validate a downside extension toward 0.9693–0.9495.
- Keep an eye on shifts in BTC/ETH ETF flow signals as a broader market risk-on/off backdrop, noting these are contextual indicators for XRP rather than primary drivers.
- Assess changes in volatility regime and breadth, which may precede a shift in the current bearish bias.
Hashtags: #XRP #CryptoAnalysis #TechnicalAnalysis #ETFFlows #BTC #ETH #MarketSnapshot #PriceAction #TradingStrategy #CryptoNews #AltMarket #MarketContext