
Market Snapshot
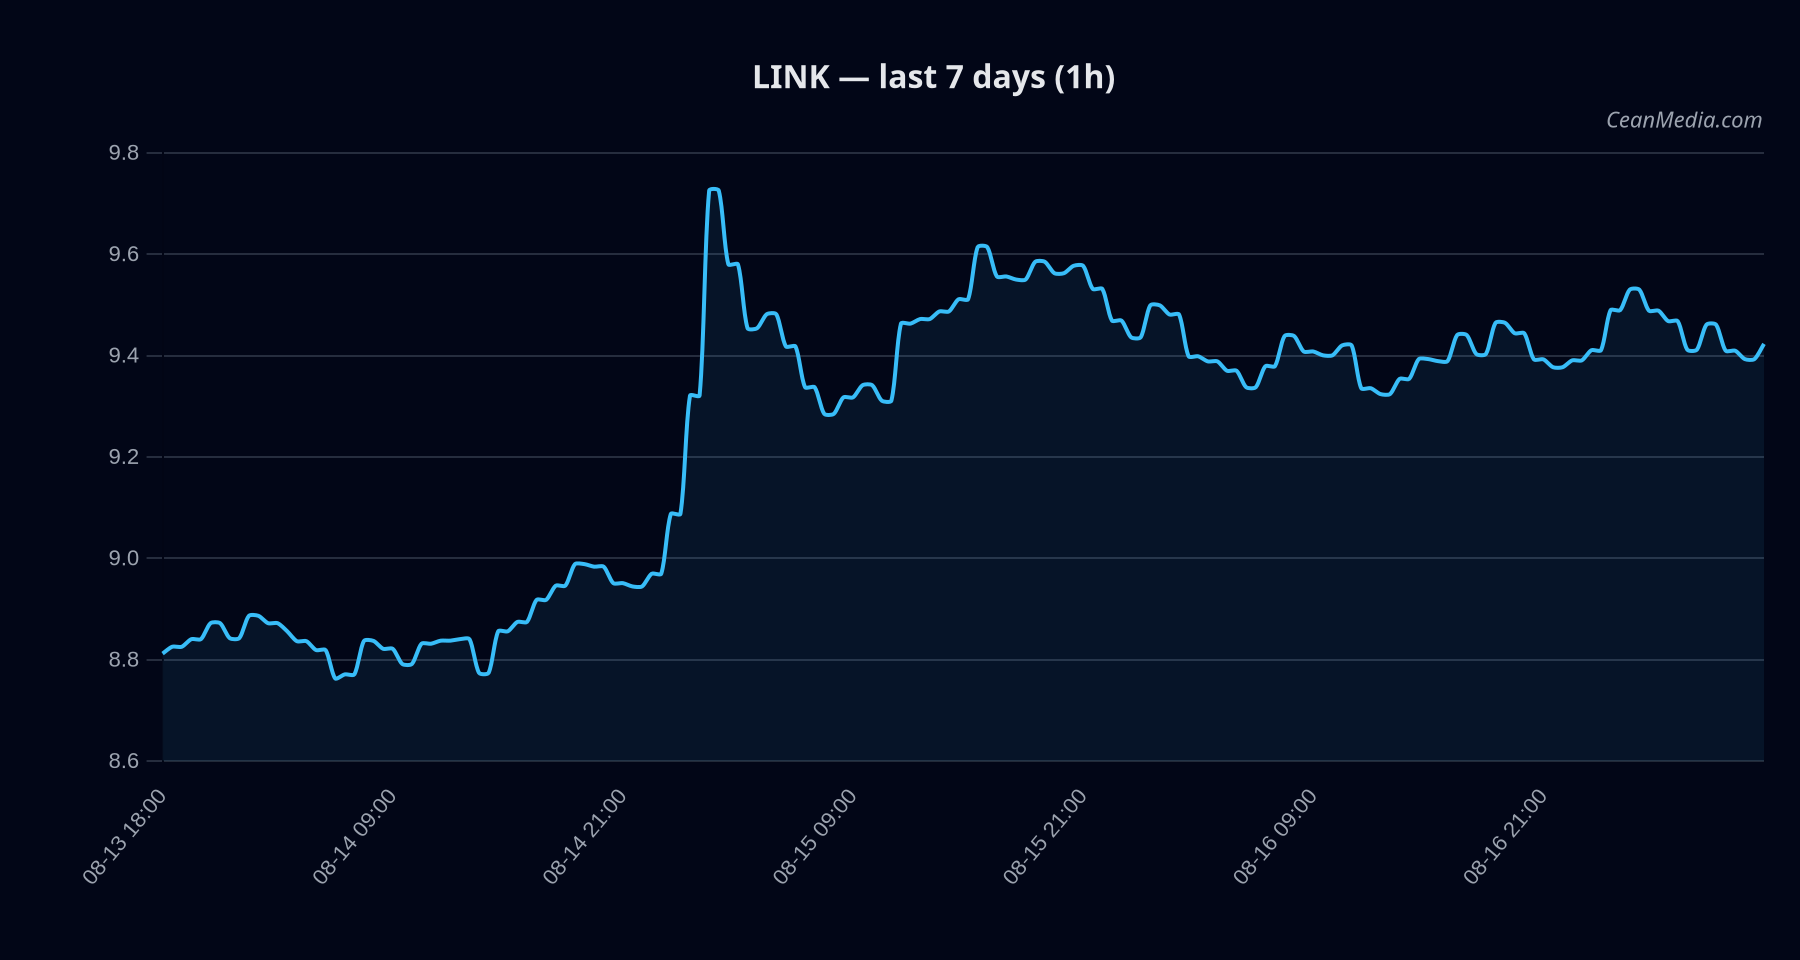
As of 2026-08-17, LINK shows a mixed/neutral bias with low conviction (5/100). The composite score is -0.8 with a single conflicting signal. Price sits around the 9.4 level, with near-term support and resistance forming a tight range. Overall market breadth is modest (33% above SMA50) and BTC correlation over 72 hours stands at 0.31, suggesting limited cross-asset momentum affecting LINK directly at this time.
Technical Analysis: LINK
-0.8 9.423 bullish indicators in place: EMA12>EMA26, SMA50>SMA200, RSI ~50, volatility regime: very low (σ24h 0.44%). 9.3129 8.8079 – 9.8151 - Support near 9.24
- Major support 8.52
- Resistance near 9.62
- Major resistance 9.4
- Up trigger: close > 9.62 → potential move towards 9.8037–9.9959
- Down trigger: close < 9.24 → potential move towards 9.0498–8.8652
Context notes: The model presents a bearish bias on a 24-hour horizon, but technicals show bullish signals via EMA/SMA alignment and RSI near neutral. The volatility regime is very low, which can compress moves and prolong consolidation within the current range.
Drivers
Return 24H: +0.0016, EMA slope: -0.0001, Funding z-score: 0.698, Basis z-score: 0.236, OB/EMA5 imbalance: 0.106, BTC return 24H: +0.0053
Vol regime is very low; vol-of-vol is low; breadth ~33% above SMA50; BTC dominance trend: -0.48 over 7D; fear index (F&G): 31 Taker flow: balanced (7.2%), positioning: long crowded (1.28x).
ETF Flows (BTC/ETH)
The ETF flow data provided covers BTC and ETH rather than LINK directly. 1D BTC ETF flows show -$56.2M, with a 5D move of -$331.6M and 10D +$533.7M; ETH ETF flows show minimal 1D movement and positive 5D/10D flows. This context indicates renewed or shifting risk-on/off appetite in the broader crypto market, but it should be noted that ETF data for BTC/ETH is context and not a primary signal for LINK. LINK remains influenced by its own technicals and cross-asset risk sentiment rather than ETF flows alone.
What to Watch Next
- Monitor for a close above 9.62 to validate upside continuation toward 9.8037–9.9959.
- Watch for a break below 9.24 to confirm potential move toward 9.0498–8.8652.
- Observe changes in BTC/ETH ETF flows as a broader risk-on/off signal, recognizing this is contextual rather than a direct LINK signal.
- Keep an eye on volatility regime; a shift from very low could precede larger price moves.
Hashtags: #LinkAnalysis #CryptoMarkets #TechnicalAnalysis #LINKPrice #ETFFlows #BTC #ETH #MarketContext #RiskOn #RiskOff #Blockchain