
Market Snapshot
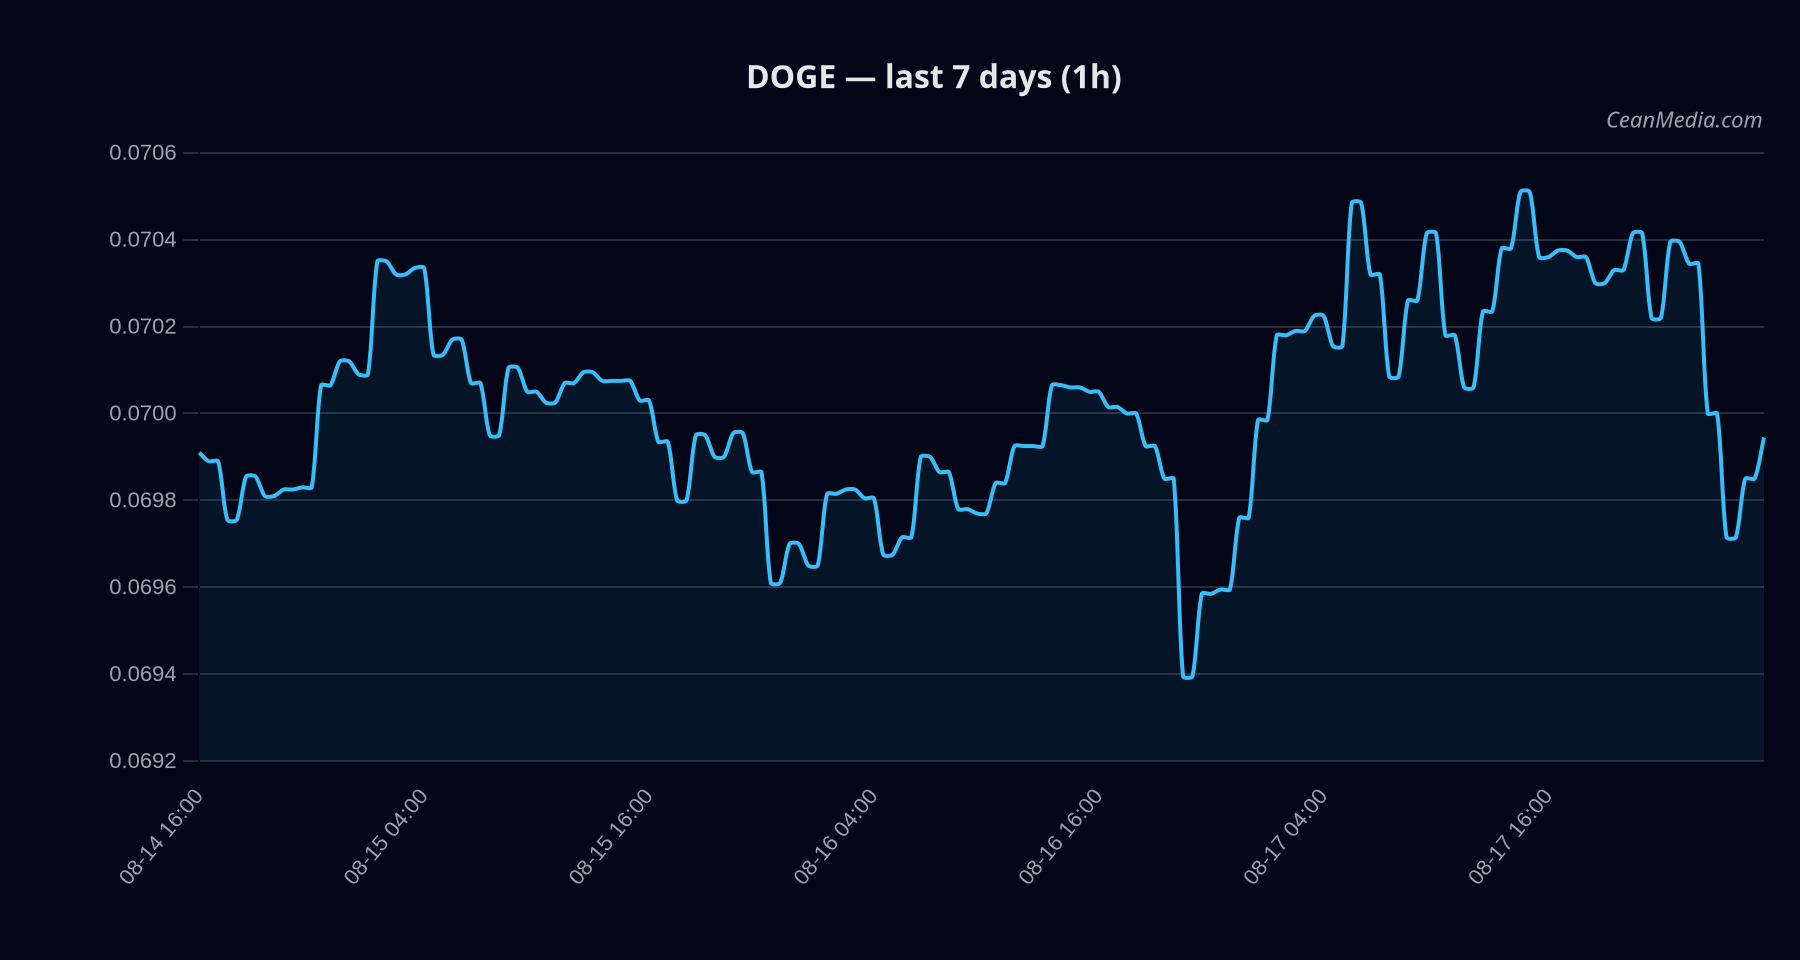
Dogecoin (DOGE) sits in a tight intra-range near 0.069, within a defined support near 0.068 and resistance near 0.071. The current bias is bearish with a composite score of -3.7 and low certainty (41/100). Market data indicates very low volatility and a muted price action environment.
Technical Analysis: DOGE
- Price: Close 0.0699.
- Trend and indicators:
- TA trend: bearish
- RSI: 43 (neutral)
- EMA12 < EMA26
- SMA50 < SMA200
- σ24h: 0.24% (low volatility)
- Vol regime: Very low
- Forecast: Model indicates down with 47% probability; price range P50 0.0697; P20–P80 0.0689–0.0732.
- Levels:
- Support: near 0.068; major 0.069
- Resistance: near 0.071; major 0.071
- Triggers:
- Up: 1h close > 0.071 → potential move toward 0.0727–0.0741
- Down: 1h close < 0.068 → potential move toward 0.0671–0.0657
- Invalidation: A sustained break above the major resistance or below major support would alter the current bearish bias and trigger re‑assessment.
Drivers
- Top model drivers include stability metrics and cross-asset z-scores with mixed contributions.
- Momentum/volatility: Very low vol regime; 24h return near flat; BTC correlation remains elevated (ρ ~ 0.68 over 72h).
- Key signals indicate modest downside pressure in the near term with limited upside momentum.
ETF Flows (BTC/ETH)
ETF flow data covers BTC and ETH, not DOGE. The latest observations show: BTC ETF flows: +$137.3M in 1D, -$103.3M in 5D, +$500.9M in 10D; ETH ETF flows: +$5.0M in 1D, +$16.6M in 5D, +$277.5M in 10D. These figures provide a context for macro risk appetite and liquidity dynamics but are not a primary signal for DOGE. In practical terms, a risk-on environment supported by sizable BTC/ETH buying could coincide with broader market buoyancy, while risk-off conditions align with caution across altcoins including DOGE.
What to Watch Next
- Watch for a close above 0.071 on an hourly basis to trigger a potential shift toward 0.0727–0.0741.
- Monitor any break below 0.068 for potential move to 0.0671–0.0657.
- Observe changes in volatility regime and market breadth, which may precede larger moves.
- Keep an eye on BTC/ETH ETF flow momentum as contextual signals for overall market risk sentiment.
Hashtags: #Dogecoin #DOGEanalysis #CryptoMarkets #TechnicalAnalysis #ETFFlows #BTC #ETH #MarketSnapshot #PriceLevels #TradingStrategy #Volatility