
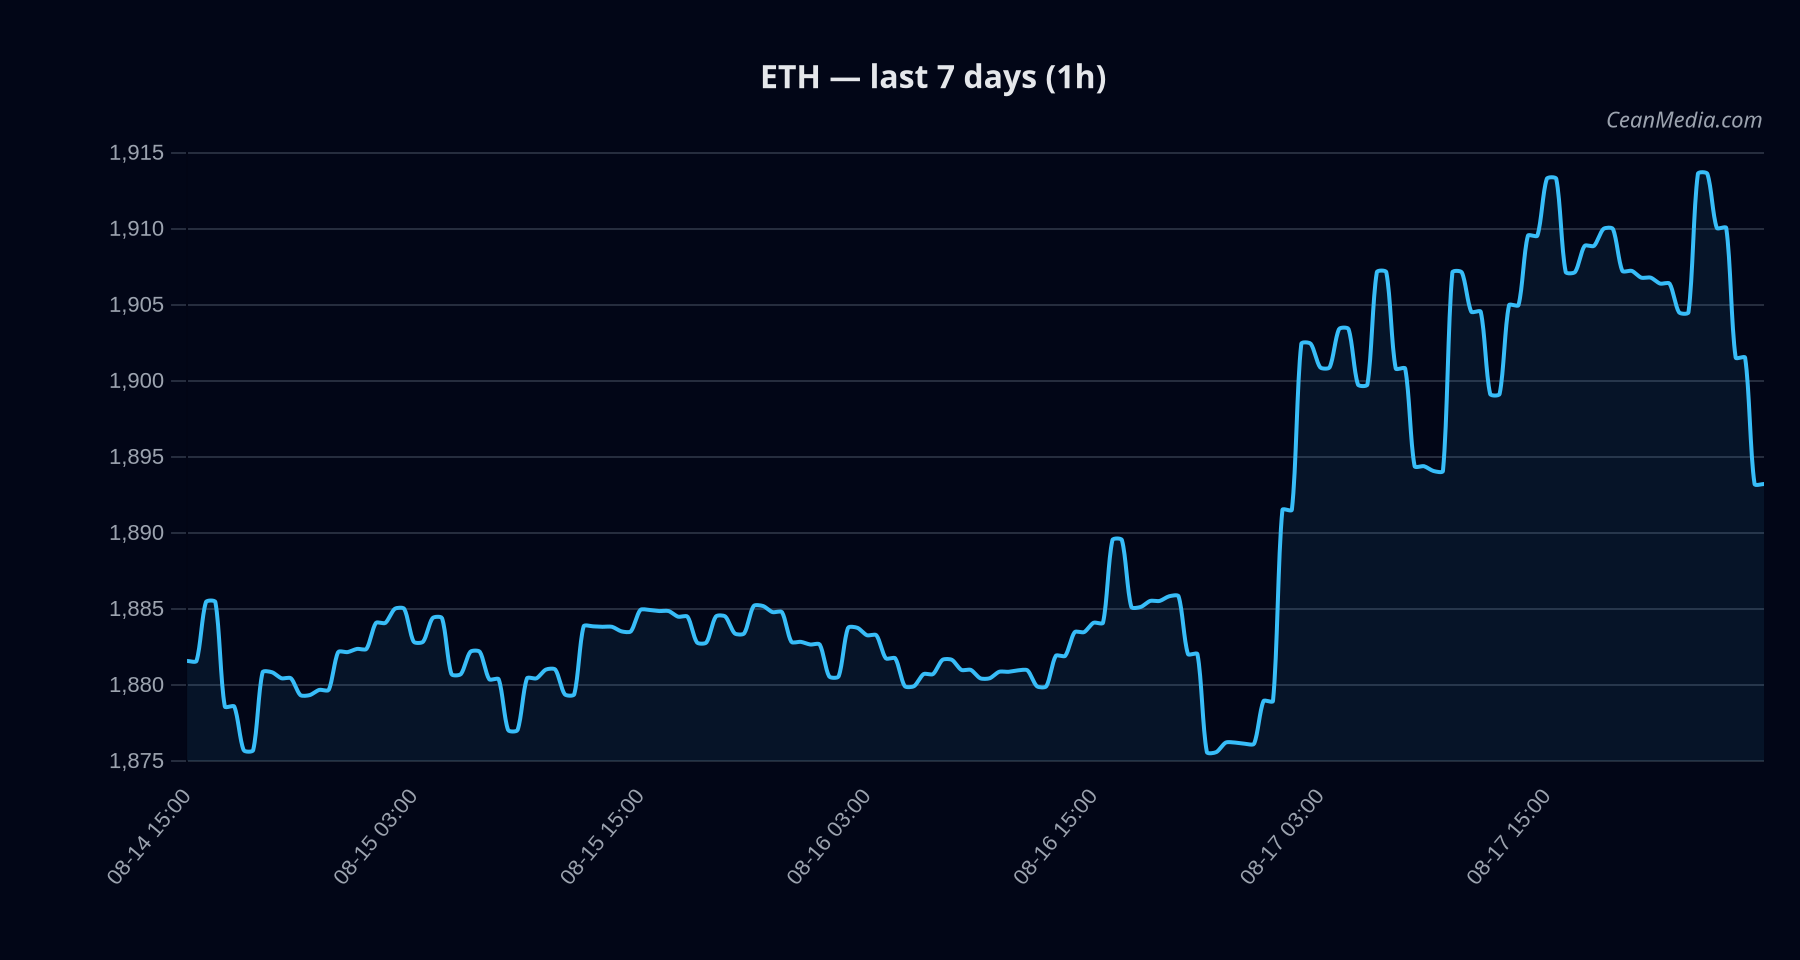
Market Snapshot
Price: ETH around 1,894.9 with very low volatility regime. The model indicates mixed to bullish pressure with low certainty (5/100). The forecast range for the next 24 hours places the P50 near 1,904.33, with a broader potential 1,842.08–1,924.48. Breadth remains around 50% above the 50-day moving average, and BTC-ETH correlation stands at 0.88 over 72 hours, suggesting a tethered dynamic to broader crypto risk sentiment.
Technical Analysis: ETH
: +1.2 (conflicts: 1). : EMA12 > EMA26, SMA50 > SMA200; volatility (σ24h) 0.28%; vol regime: very low. - Support near 1,858; major support at 1,864.
- Resistance near 1,932; major resistance at 1,918.
- Up: 1h close > 1,932 targets 1,971.45 to 2,010.11.
- Down: 1h close < 1,858 targets 1,819.86 to 1,782.72.
Drivers
: - Return 24h: -0.48%
- EMA slope: -0.11% signal
- Funding Z-score: 0.43
- Basis Z-score: -0.05
- Order-book imbalance (EMA5): 0.26
- BTC 24h return: +1.10%
: Very low vol regime; BTC-ETH correlation strong (0.88); volatility indicators at or near baseline. : Fear index around 41 (F&G); ETF flows indicate mixed positioning with notable ETH ETF inflow over 5 and 10 days, while BTC ETFs show outflows at 1D but inflows over longer horizons.
ETF Flows (BTC/ETH)
Context note: ETF data covers BTC and ETH only and should be treated as supplementary context rather than a primary ETH signal. The latest data shows:
: 1D -$56.2M; 5D -$331.6M; 10D +$533.7M : 1D +$0.0M; 5D +$16.9M; 10D +$260.6M
The ETH ETF inflows over 5–10 days suggest some institutional appetite for ETH exposure, while BTC ETF outflows at the 1D horizon could reflect short-term risk-off or rebalancing. However, ETH/ BTC flows should not be interpreted as a primary driver of ETH price; price action appears more tightly linked to spot technicals and cross-market risk sentiment in the current window.
What to Watch Next
- Watch for a 1h close above 1,932 to confirm upside continuation toward 1,971–2,010.
- Monitor a daily close below 1,858 for potential acceleration toward 1,820–1,783.
- Observe changes in BTC–ETH correlation and overall risk-on/risk-off shifts in broader markets.
- Track revised ETF flow data and any regime change in volatility that could impact breakout likelihood.
Hashtags: #ETH #Ethereum #TechnicalAnalysis #ETFFlows #CryptoMarkets #MarketSetup #TradingView #PriceAction #Momentum #Volatility #BTC #Altcoins