Market Snapshot
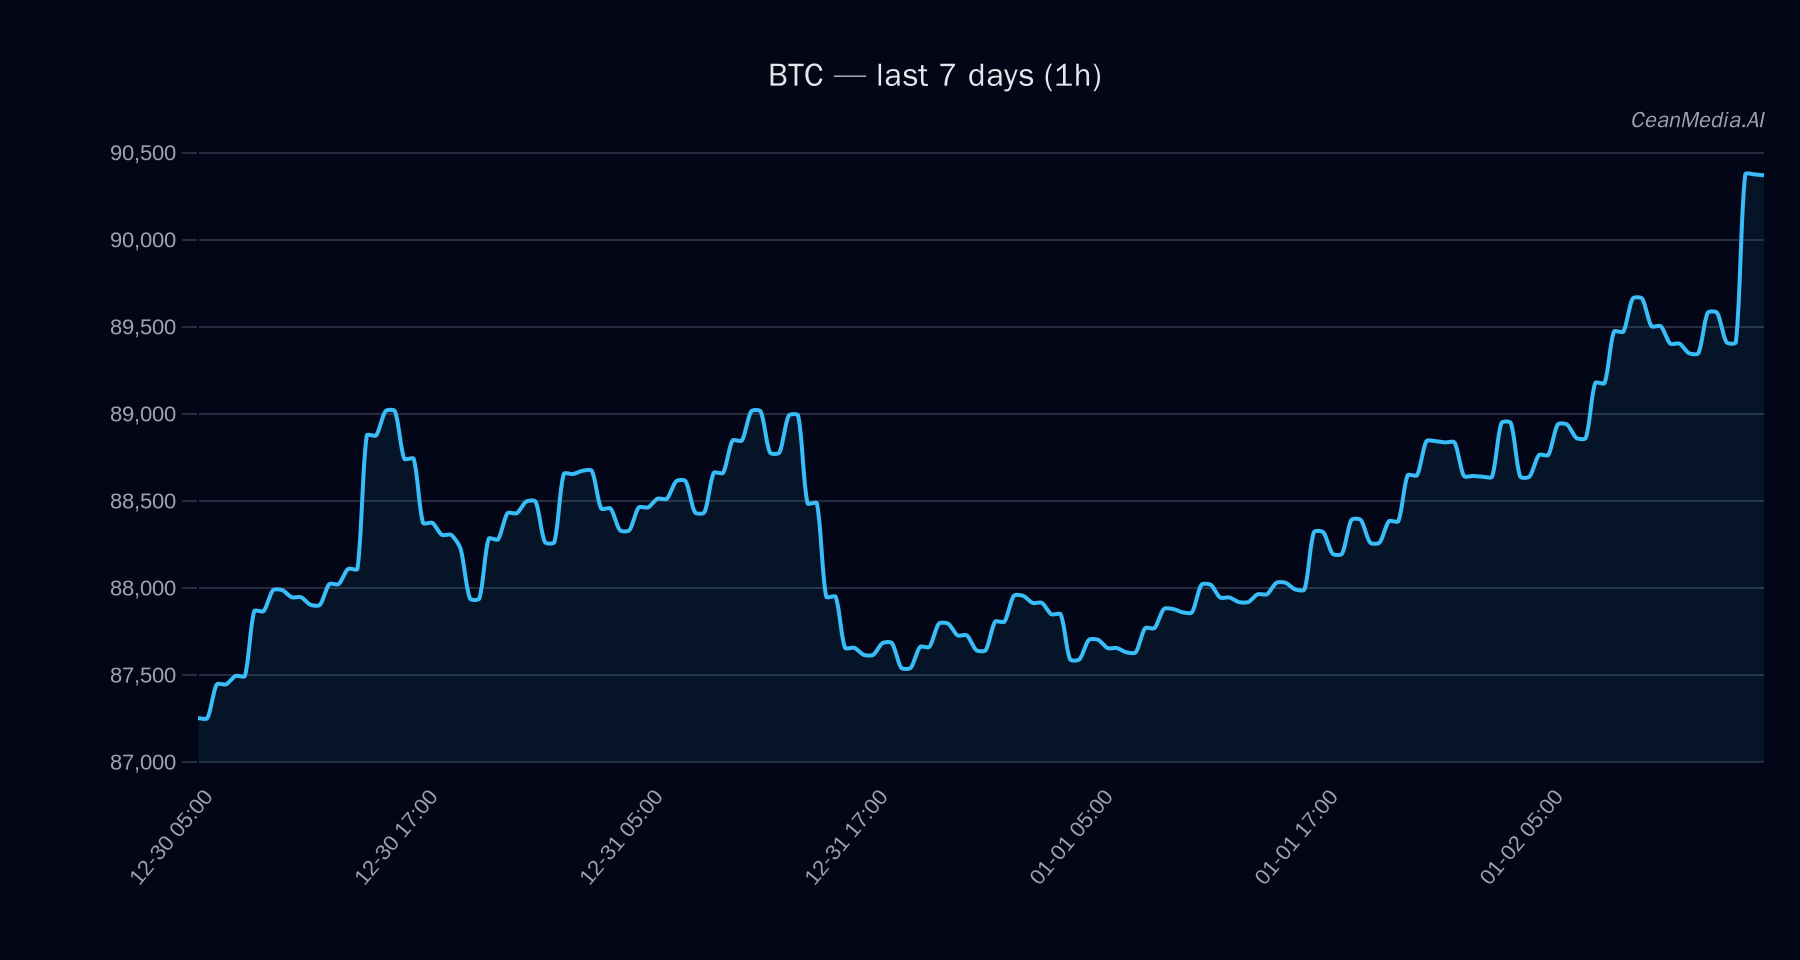
As of January 2, 2026, Bitcoin (BTC) is trading around $90,232, with a short-term bias leaning towards a downward move. Market sentiment remains cautious amid very low volatility, with recent ETF flows indicating sustained outflows from both BTC and ETH investment products. The broader market breadth remains robust, with a 100% breadth indicator and a perfect 1.00 correlation over 72 hours, suggesting strong underlying market participation.
Technical Analysis: BTC
Bitcoin’s current price sits between key support at approximately $88,425 and resistance at around $92,025. A break above resistance could target levels near $93,877 to $95,718, while a decline below support may see prices fall to approximately $86,659 to $84,890. Technical indicators show bullish momentum with EMA12 above EMA26, and the SMA50 above SMA200, supporting a bullish trend despite overbought RSI at 71. The forecast indicates a 43% probability of a downward move within the next 24 hours, with key triggers being a close above $92,025 for bullish continuation or below $88,425 for correction.
Drivers
- Top drivers include a modest 0.02% return over the past 24 hours and a slight positive EMA slope (0.0012), suggesting limited upward momentum.
- Market sentiment remains cautious with a funding Z-score of -0.56 and a basis Z-score of -1.88, indicating slight bearish pressure.
- Order-book imbalance (EMA5) remains negative at -0.27, reflecting selling pressure at the short-term level.
- Volatility regime is very low, with trend strength at approximately 1.44, pointing to subdued but persistent trend activity.
ETF Flows (BTC/ETH)
Recent ETF data shows continued outflows: BTC ETFs have experienced a 1-day decline of approximately $348 million, with a total outflow of nearly $686 million over five days and over $917 million in ten days. ETH ETF outflows are also notable, with a $72 million decline in one day and similar outflows over five and ten days. These flows suggest a risk-off environment, although they are only relevant to BTC and ETH ETFs and should be considered as contextual rather than primary signals for Bitcoin’s price trajectory.
What to Watch Next
- Watch for a decisive break above $92,025 to confirm bullish continuation targeting near $95,718.
- Monitor support at $88,425; a break below this level could accelerate a correction toward $86,659 or lower.
- Keep an eye on ETF outflows, as persistent declines may influence broader market sentiment.
- Observe upcoming macroeconomic developments that could impact risk appetite and liquidity conditions.
Hashtags: #Bitcoin #CryptoAnalysis #BTC #MarketTrends #ETFFlows #CryptoNews #TechnicalAnalysis #CryptoInvesting #FinancialMarkets #CryptoForecast #DigitalAssets #Trading