Market Snapshot
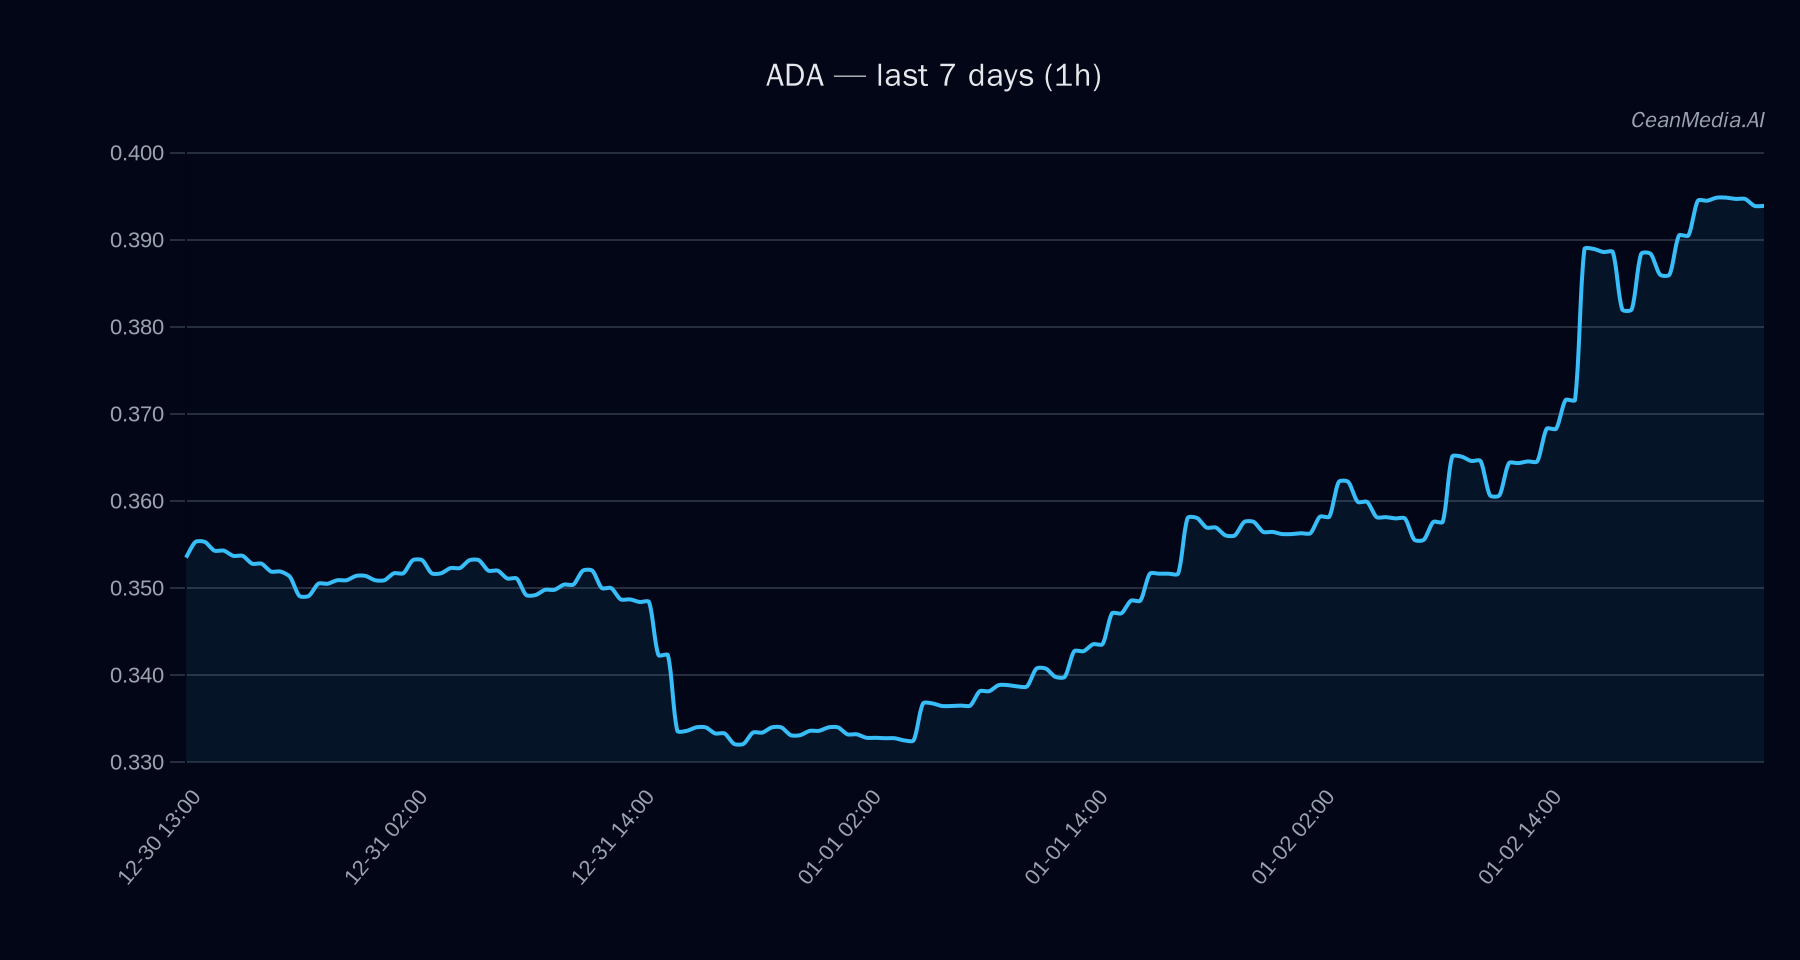
On January 3, 2026, Cardano (ADA) is trading around $0.3968, with a short-term bias leaning towards downside. The market exhibits low volatility with a current sigma of 1.24%, and technical indicators suggest overbought conditions. Broader market sentiment shows a risk-off environment, with significant ETF outflows in Bitcoin and Ethereum over the past week.
Technical Analysis: ADA
ADA is currently positioned between key support at approximately $0.39 and resistance near $0.405. A break above $0.405 could target levels around $0.4128 to $0.4209, while a decline below $0.39 may test support at $0.3811 to $0.3733. The technical setup remains bullish with EMA12 above EMA26, SMA50 above SMA200, and an RSI at 77 indicating overbought conditions. Despite bullish momentum signals, the forecast suggests a 52% probability of downward movement in the short term, primarily due to overbought signals and market breadth.
Drivers
- 24H Return: +0.08%
- EMA Slope: +0.0009, indicating mild upward momentum
- Funding Z-Score: 0.52, showing moderate funding sentiment
- Basis Z-Score: 1.22, suggesting potential bullishness
- Order Book Imbalance (EMA5): -0.0011, indicating slight sell pressure
- BTC 24H Return: +0.01%, reflecting stable Bitcoin market
- BTC Volatility Regime: Low
- BTC Trend Strength: 0.73, showing moderate trend momentum
The overall drivers point to a cautious market with technical indicators overextended and some underlying bullish momentum. Volatility remains subdued, but overbought RSI levels warrant caution.
ETF Flows (BTC/ETH)
Recent ETF data indicates significant outflows: Bitcoin ETFs have seen a total decline of approximately $348 million daily, $685 million over five days, and nearly $918 million over ten days. Ethereum ETFs have experienced smaller but consistent outflows, totaling $72 million daily, $109 million over five days, and $213 million over ten days. These persistent outflows suggest a risk-off environment, which can influence broader market sentiment but should be interpreted as context rather than a primary signal for ADA.
What to Watch Next
- Monitor ADA’s price action around the $0.39 support and $0.405 resistance levels for potential breakout or breakdown triggers.
- Observe broader market sentiment and ETF flows, especially in Bitcoin and Ethereum, for signs of risk-on or risk-off shifts.
- Keep an eye on overbought RSI conditions and declining volatility for signs of potential trend reversal or consolidation.
- Watch for any significant changes in order book imbalance or funding rates that could impact short-term direction.
Note: ETF flows are only available for BTC and ETH and serve as broader market context; they are not direct indicators for ADA.
Hashtags: #CryptoAnalysis #ADA #Bitcoin #Ethereum #MarketUpdate #TechnicalAnalysis #CryptoFlows #RiskOff #Altcoins #TradingStrategy #MarketTrends #CryptoForecast