Market Snapshot
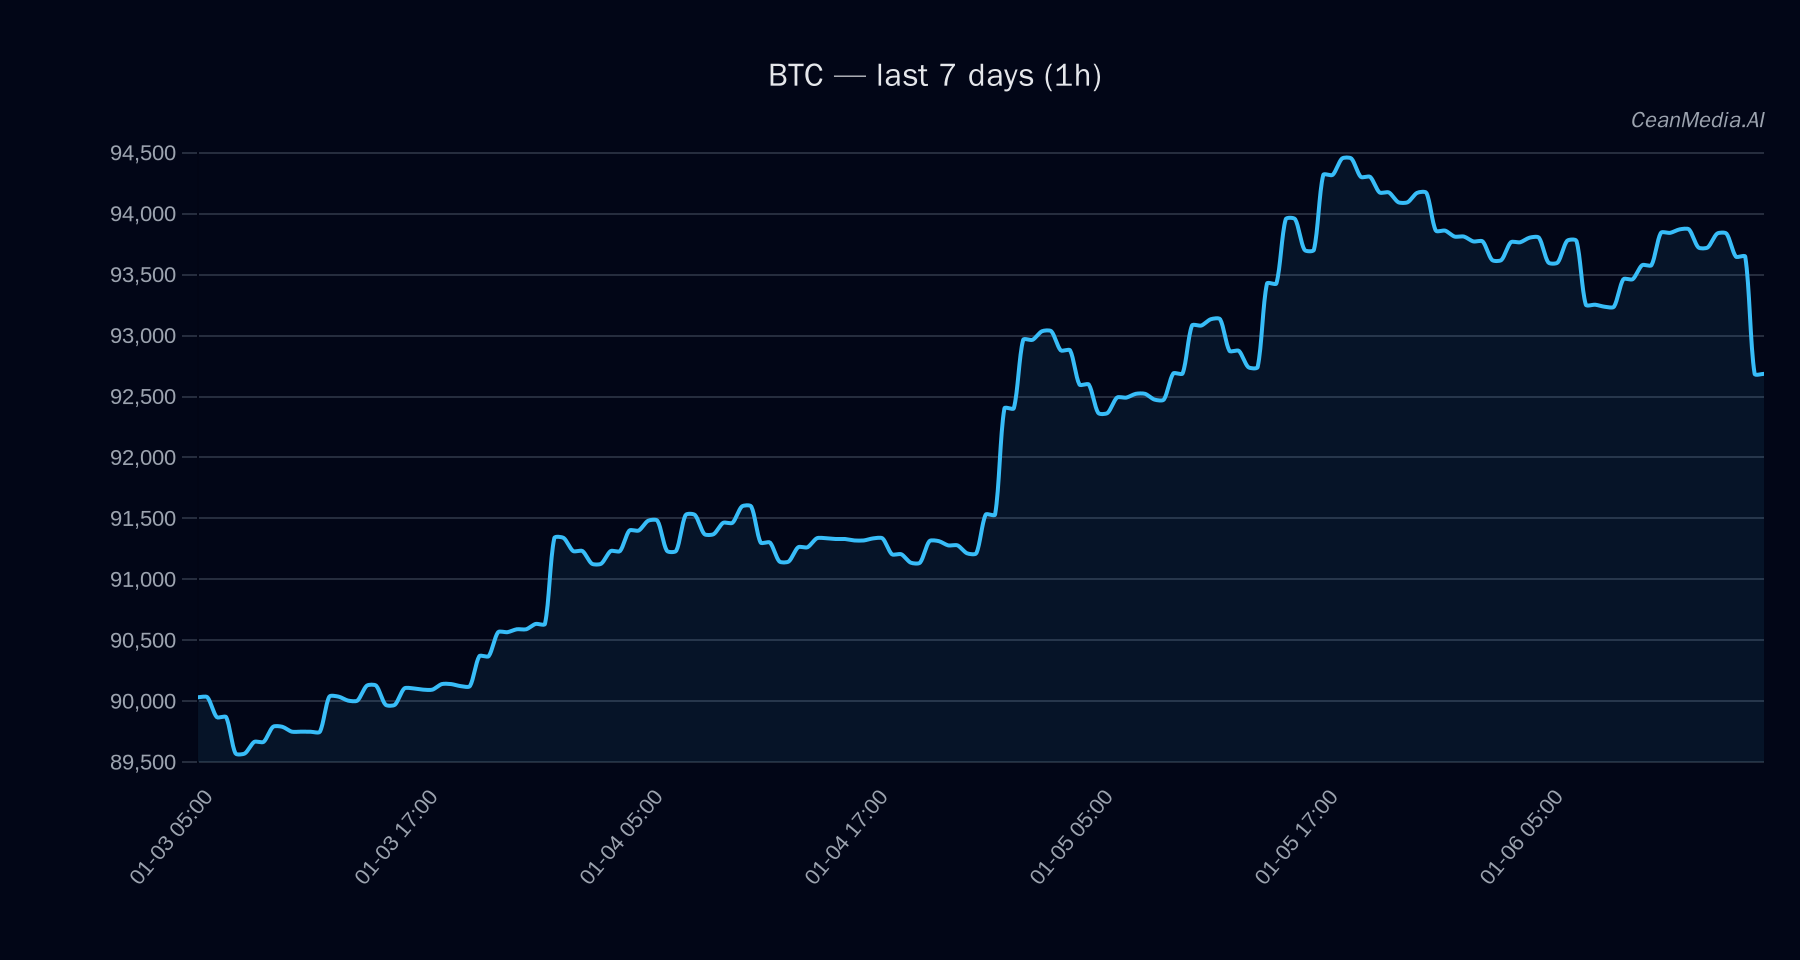
As of January 6, 2026, Bitcoin (BTC) trades at approximately $92,686. The current technical landscape indicates a sideways bias with a modest probability of upward movement. Market sentiment remains cautious, reflected in very low volatility and neutral momentum indicators. ETF flows for BTC and ETH over recent periods continue to influence investor positioning, although they are not primary signals for immediate price direction.
Technical Analysis: BTC
Bitcoin is currently trading between key support at $90,825 and resistance at $94,550. A breakout above $94,550 could target levels around $96,431 to $98,322, while a decline below support may see prices fall towards $89,016 to $87,199. The technical signals show a slight tilt towards sideways movement, with EMA12 above EMA26, SMA50 above SMA200, and RSI at 37 indicating a neutral stance. The short-term forecast suggests a 42% probability of upward movement, but overall bias remains cautious due to very low volatility and mixed momentum indicators.
Drivers
- Return 24H: Slight decline of -0.01%, indicating minimal short-term momentum.
- EMA Slope: Slight negative slope (-0.0014), signifying a weak downward trend in recent momentum.
- Funding Z-Score: -0.64, suggesting slightly negative funding sentiment.
- Basis Z-Score: -0.14, indicating near-neutral basis conditions.
- Order Book Imbalance (EMA5): 0.04, reflecting balanced order flow.
- BTC Trend Strength: 0.91, denoting a relatively strong trend but with caution due to volatility regime.
Overall, momentum remains subdued, with volatility regimes at very low levels, supporting a sideways trading environment.
ETF Flows (BTC/ETH)
Recent ETF flow data show inflows for both BTC and ETH, with BTC ETFs experiencing a 1-day inflow of +$92.4 million, a 5-day inflow of +$329.1 million, and a 10-day outflow of -$617.2 million. ETH ETFs, meanwhile, have seen consistent inflows over the same periods, notably +$43.3 million in 1D and +$200.4 million over 5D. These flows suggest a cautious risk-on environment, with investors increasing exposure to both assets, although the recent 10-day outflow for BTC indicates some short-term profit-taking or risk reassessment. It is important to note that ETF flows for BTC and ETH are only contextual and should not be solely relied upon for trading decisions.
What to Watch Next
- Monitor the price break above resistance at $94,550 for potential upward targets around $96,430 to $98,321.
- Watch for a break below support at $90,825, which could lead to declines toward $89,016 and below.
- Keep an eye on ETF inflow trends for BTC and ETH as supplementary market sentiment indicators.
- Observe changes in volatility and momentum indicators for early signs of trend shifts.
Note: ETF flow data is specific to BTC and ETH and is provided as contextual information rather than a primary trading signal.
Hashtags: #Bitcoin #CryptoAnalysis #BTC #ETH #ETFFlows #MarketTrends #TechnicalAnalysis #CryptoInvesting #Blockchain #DigitalAssets #MarketInsights #FinancialAnalysis