Market Snapshot
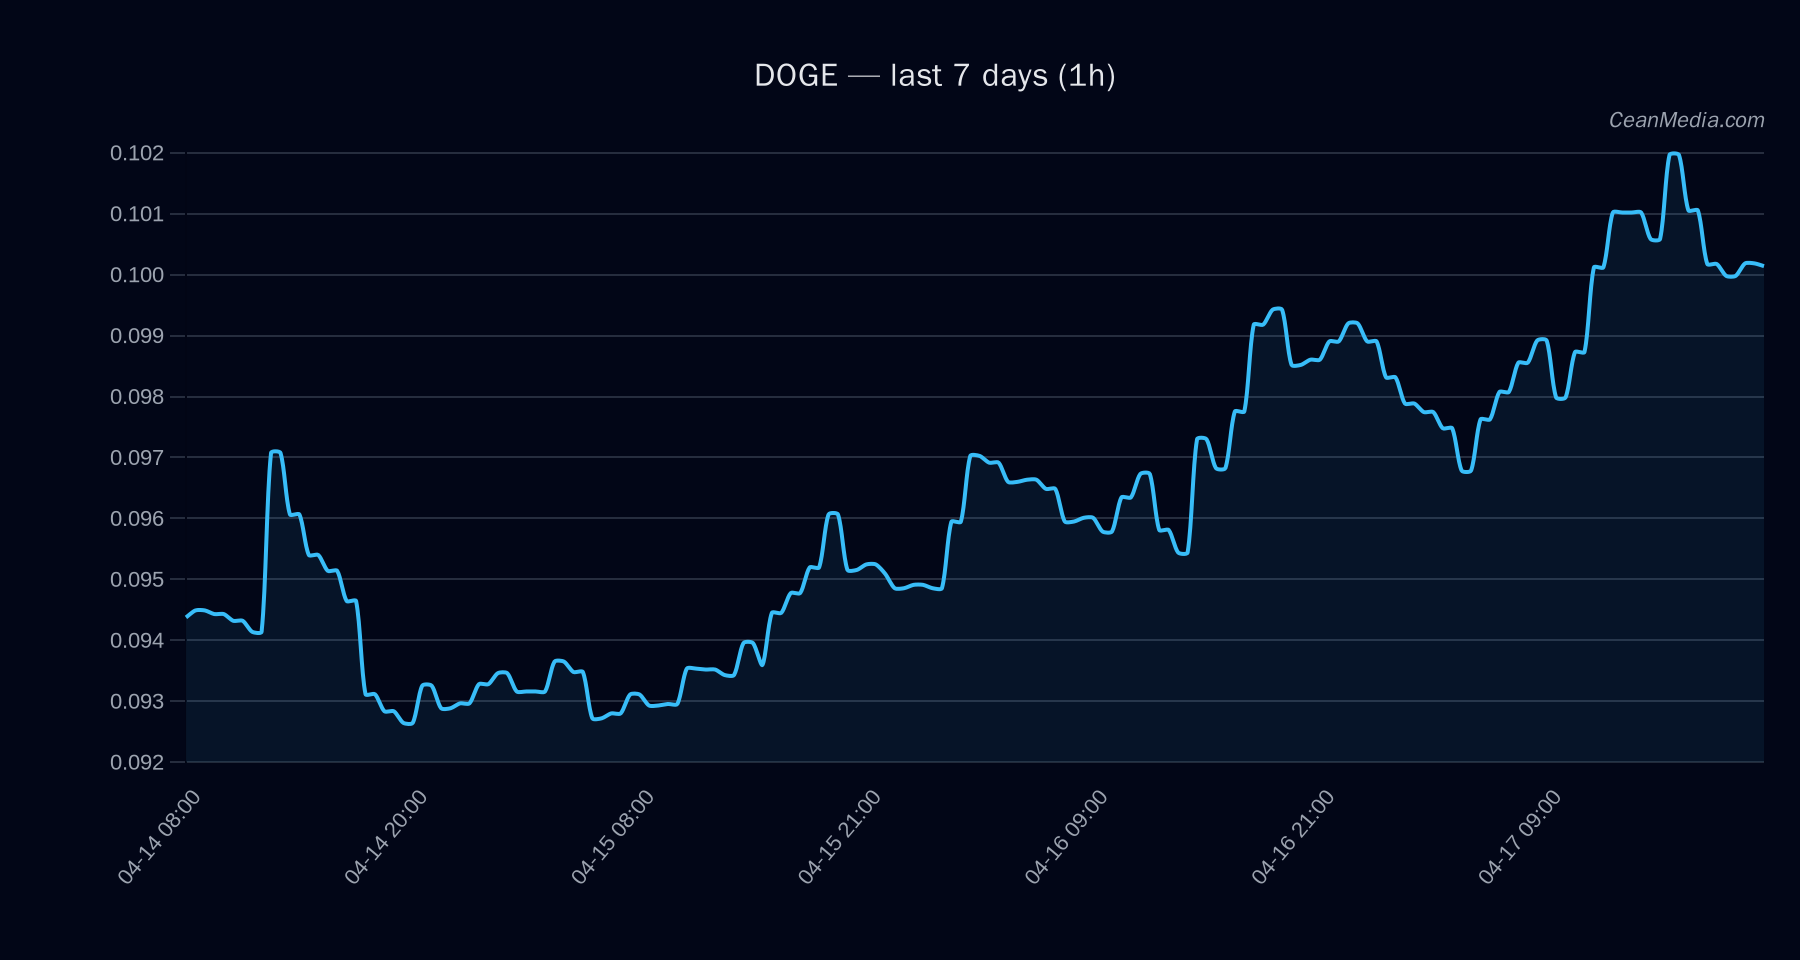
On 2026-04-17, DOGE was nearing a key resistance zone around 0.10, with a bullish short-term bias suggested by the technical view. The price hovered at approximately 0.1002, placing it at the cusp of a potential breakout above 0.10 or a pullback toward 0.098 or lower. Overall context shows very low volatility with a narrow band width, and breadth indicators remain positive for risk appetite in the near term.
Technical Analysis: DOGE
0.1002 Up (50% probability) EMA12 > EMA26, SMA50 > SMA200, RSI 57, volatility (σ24h) 0.66%, very low volatility regime Major support 0.091; near support 0.098; major resistance 0.096; near resistance 0.10 1h close > 0.1 → target 0.1043–0.1063 1h close < 0.098 → range 0.0963–0.0943 0.092 – 0.1042 The price is probing resistance near 0.10. A confirmed break above 0.10 would imply a potential move toward 0.1043–0.1063. A break below 0.098 increases the likelihood of a test of 0.094–0.096 range. The current RSI is neutral at 57, suggesting room for upside if momentum sustains.
Drivers
SPREAD Z-SCORE (6.61, value -30.09), SPREAD BP (-5.72, -9.74), DEPTH Z-SCORE (-2.22, -33.74), DEPTH USD 10BP LOG1P (1.86, -16.41), LS GLOBAL Z-SCORE (-1.02, -4.32) RV 7D (0.53, -1.03), BREAKOUT 7D (-0.37, 1.45), BTC return 24h (0.03) against a backdrop of low BTC volatility regime Positive tilt with some negative breadth signals; volatility regime remains very low, suggesting price action could be sensitive to micro-structure signals.
ETF Flows (BTC/ETH)
The ETF flow data provided covers BTC and ETH rather than DOGE and should be interpreted as market-context information rather than a primary DOGE signal. Current BTC/ETH ETF flows show positive intraday to short-term accumulation:
1D +$9.4M; 5D +$226.7M; 10D +$495.8M 1D +$29.3M; 5D +$166.5M; 10D +$139.3M
Interpretation: The flows indicate a risk-on backdrop for BTC/ETH with notable inflows over multiple horizons. This context can influence correlated assets and general market sentiment, but ETF data is not a direct signal for DOGE. Investors should view these flows as supporting evidence for broader risk appetite rather than a standalone DOGE catalyst.
What to Watch Next
- Close above 0.1000 would strengthen the near-term upside scenario toward 0.1043–0.1063.
- A break below 0.098 would shift the bias toward a test of 0.096–0.094 range.
- Monitor volatility regime; a move from very low to higher volatility could accompany a breakout or breakdown.
- Keep an eye on BTC/ETH ETF flow momentum as a contextual read for overall market risk sentiment.
Hashtags: #DOGE #CryptoTrading #TechnicalAnalysis #MarketSnapshot #BTC_ETFFlows #ETH_ETFFlows #MarketContext #RiskOn #Cryptocurrency #PriceAction #Liquidity #Volatility