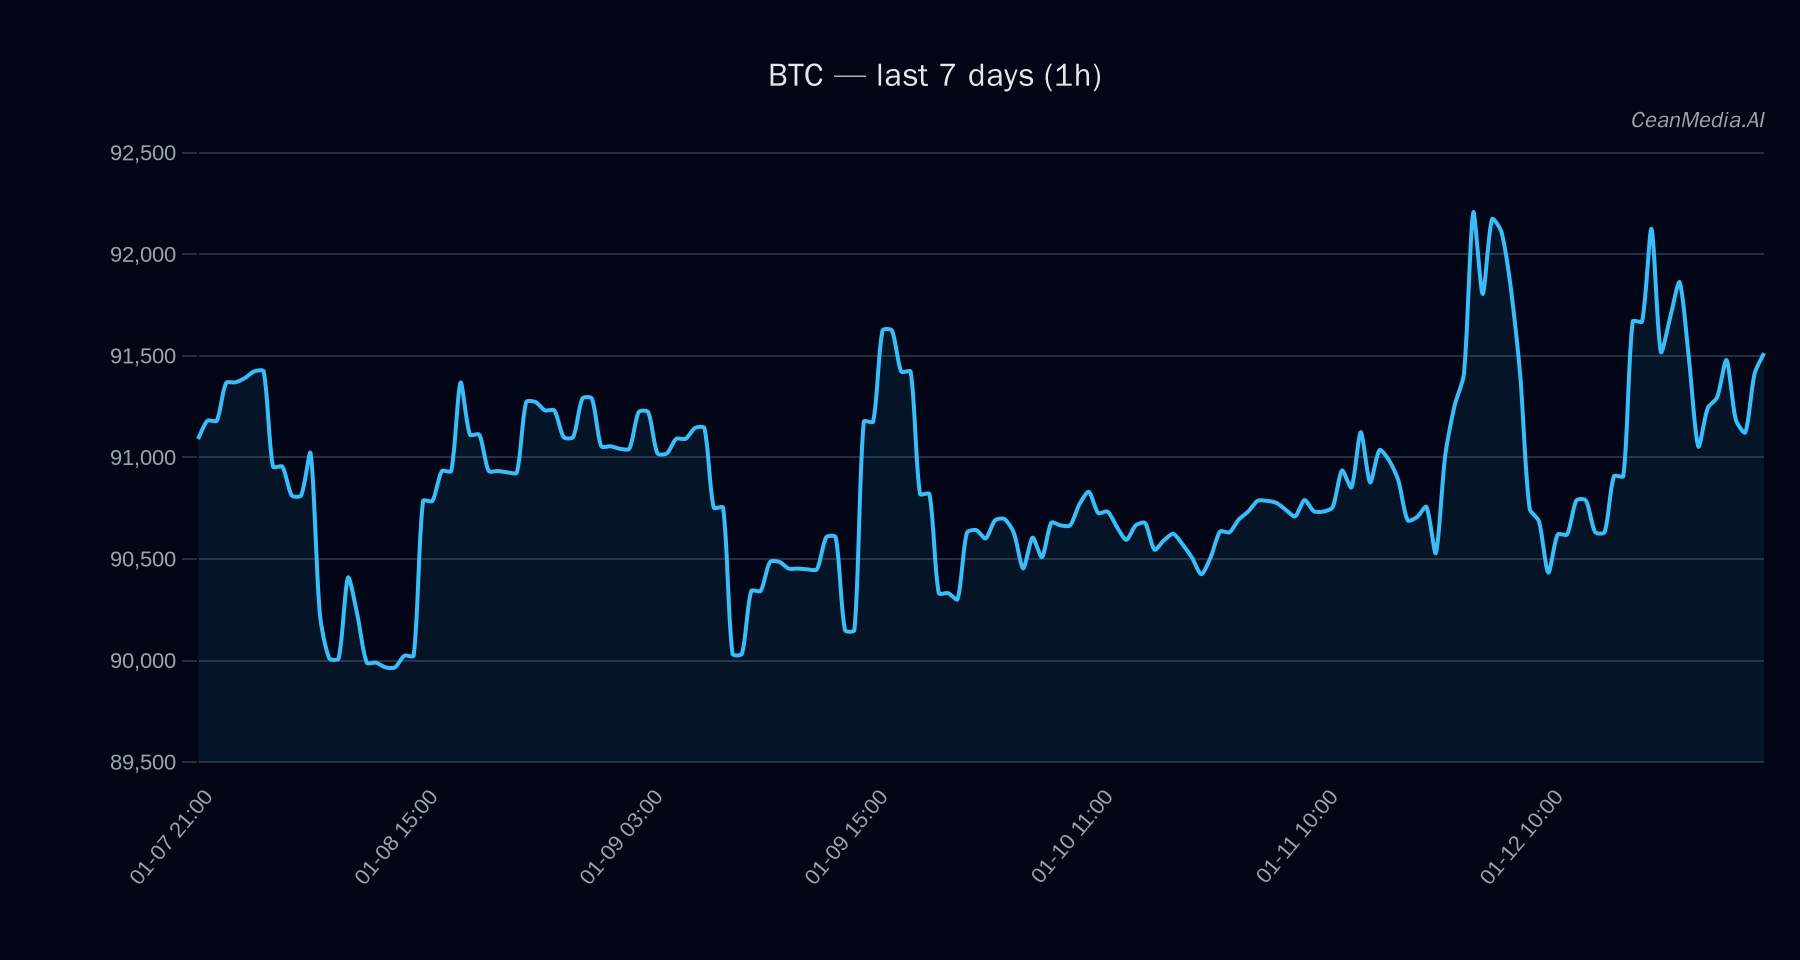
Market Snapshot
As of January 13, 2026, Bitcoin (BTC) is trading around $92,013.39, with a neutral short-term bias. The market exhibits very low volatility, and the technical indicators suggest a sideways trend within established support and resistance levels. ETF flows for Bitcoin and Ethereum show mixed signals, with recent inflows into Bitcoin ETFs but significant outflows over the past five days, indicating cautious risk sentiment among investors.
Technical Analysis: BTC
- Levels: Support at approximately $90,175; Resistance near $93,850. A break above resistance targets $95,730–$97,607, while a decline below support could see prices fall to $88,370–$86,566.
- Bias: Sideways with a slight upward tilt, supported by EMA and SMA signals, RSI at 59 indicating neutral momentum.
- Triggers: A daily close above $93,850 would confirm potential upside move towards $97,600. Conversely, a close below $90,175 could accelerate a decline towards $86,500.
- Invalidation: Failure to sustain above $93,850 or below $90,175 would suggest consolidation or a potential reversal.
Drivers
- Top Factors: Slight positive EMA slope (0.0003), but negative 24-hour return (-0.0072) indicates limited short-term momentum.
- Market Sentiment & Volatility: Funding Z-score at -0.95 suggests cautious positioning, with very low volatility regime supporting consolidation. ETF flow over 60 days shows inflows (+$187.4M daily), yet five-day flows are negative (-$1.19B), highlighting recent risk-off sentiment.
- Other Indicators: Basis Z-score at 2.29 signals some underlying strength, while order book imbalance remains slightly bearish (-0.47).
ETF Flows (BTC/ETH)
Recent ETF data shows a divergence: Bitcoin ETFs experienced a net inflow of +$187.4 million in the last day, indicating short-term risk-on appetite. However, over the past five days, Bitcoin ETFs have seen a significant outflow of -$1.19 billion, while Ethereum ETFs experienced inflows (+$80M daily and +$166.9M over 10 days). This mixed pattern suggests cautious investor positioning and a potential rotation within the crypto space, but it is important to note that ETF flows are only relevant for context and should not be solely relied upon for trading decisions on BTC.
What to Watch Next
- Monitor daily closes relative to key support ($90,175) and resistance ($93,850) levels for potential breakout signals.
- Observe ETF flow trends and broader market sentiment for clues on risk appetite shifts.
- Keep an eye on on-chain metrics and volatility regimes to gauge underlying market strength.
- Watch for macroeconomic developments or regulatory news that could impact investor risk sentiment.
Hashtags: #Bitcoin #CryptoAnalysis #CryptoTrading #MarketUpdate #BTC #Ethereum #ETFFlows #TechnicalAnalysis #CryptoNews #FinancialMarkets #RiskOn #RiskOff