Market Snapshot
Ethereum (ETH) is trading with a mixed to bearish bias as of the latest assessment. The model shows a down channel with a low confidence level (39/100), and a composite score of -3.5. Price action sits near a critical support range, with resistance identified around 1,730 and major resistance near 1,798. The 1-hour triggers indicate potential movement beyond key levels if breached, but the expectation remains cautious given low data congruence and a very low volume regime.
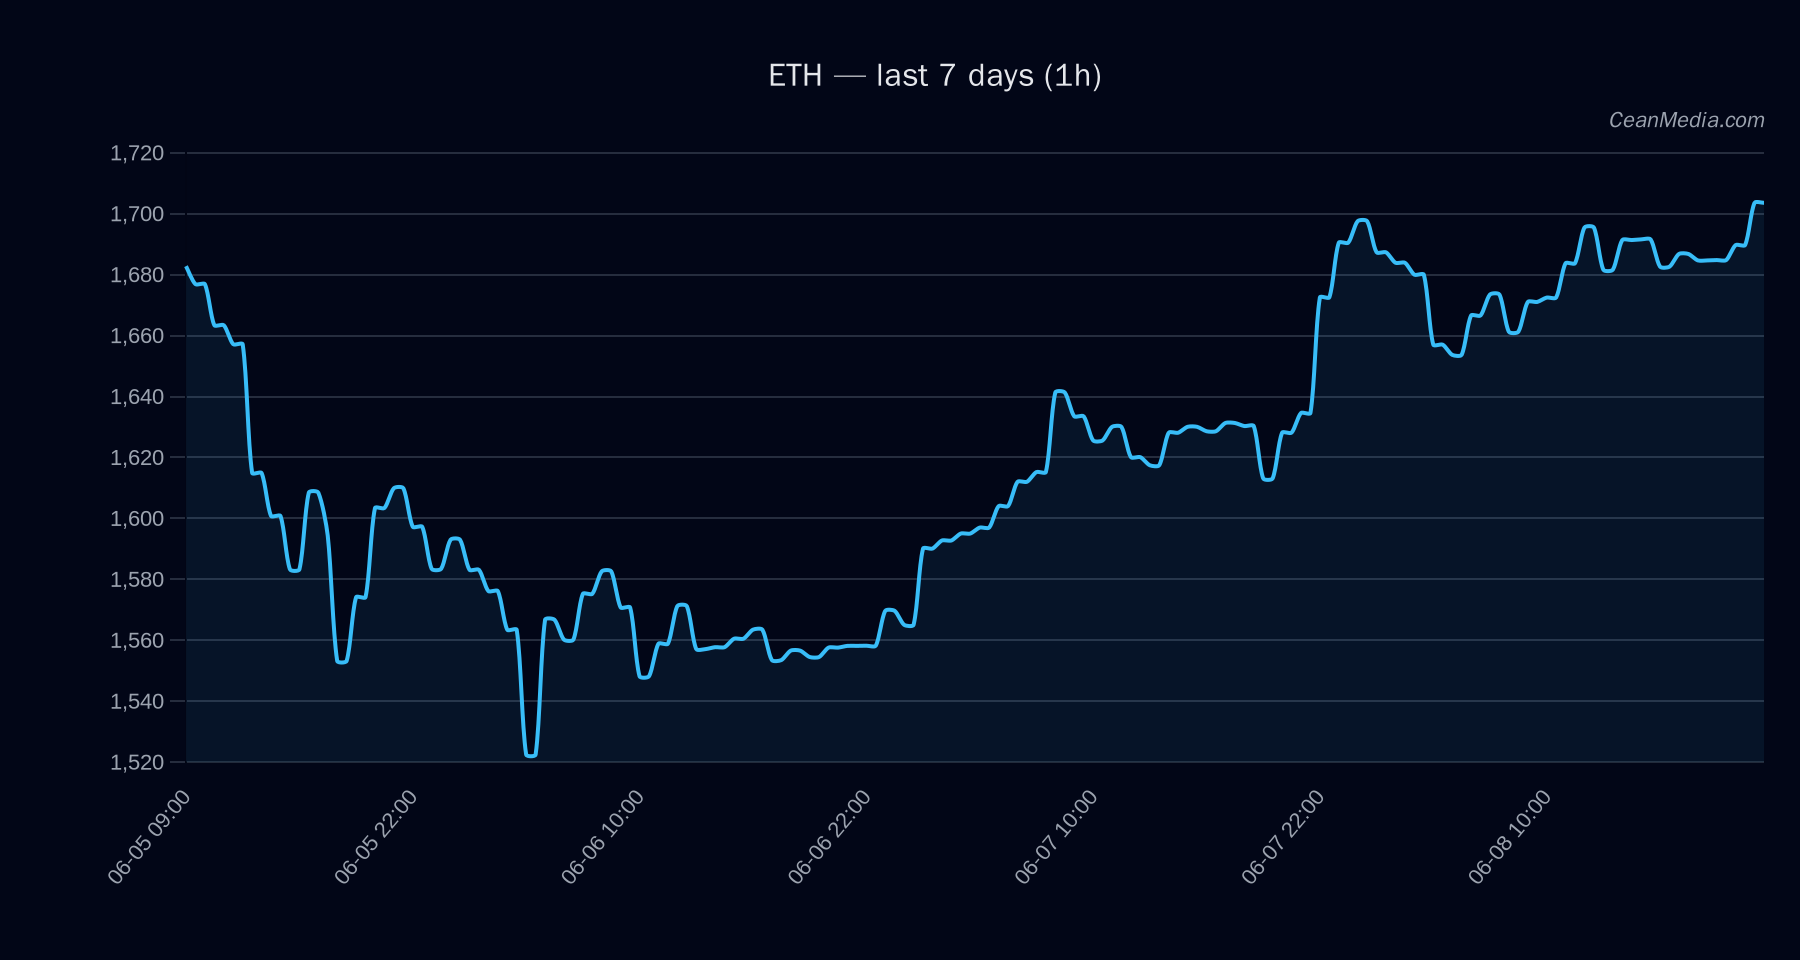
Technical Analysis: ETH
TA trend sideways; RSI 62. EMA12>EMA26; SMA50 - Up trigger: close > 1,730 (target 1,763.75–1,798.33)
- Down trigger: close < 1,662 (target 1,628.13–1,594.90)
Market breadth currently >50% with BTC 72h correlation at 0.88; overall risk assets softening; ETF data provides context but is not a primary ETH signal.
Drivers
FNG VALUE (-3.62), VIX Delta 1D (-2.76), FNG Delta 7D (+1.85), SP500 Return 1D (+1.77), Breakout 7D (-1.68), FNG Z-Score (+1.45). Broad macro signals show extreme fear in sentiment; BTC and ETH-related liquidity dynamics are in flux, with stablecoins contracting and risk assets softness noted. Very low volume regime; breadth 100% above SMA50; BTC correlation remains high (0.88); ETF flows for BTC/ETH provide ancillary context but not primary ETH signal.
ETF Flows (BTC/ETH)
ETF flow data is provided for BTC and ETH only and should be interpreted as contextual information rather than a primary signal for ETH price action. The latest data show:
1D +$629.8M; 5D +$198.4M; 10D +$585.2M. 1D +$101.2M; 5D -$20.8M; 10D +$81.6M.
Interpretation: Net BTC ETF inflows suggest ongoing risk-on appetite among BTC-related products, which can influence market sentiment broadly. ETH ETF data is modest and mixed over short horizons; as such, ETF flows are a factor to monitor but should not be treated as a primary driver for ETH pricing decisions in this analysis.
What to Watch Next
- Monitor a close above 1,730 for potential upside continuation toward 1,763–1,798.
- Watch for a break below 1,662 to confirm downside extension toward 1,628 and 1,595 levels.
- Assess volume changes as the regime remains very low; any surge in vol or breadth signals could impact directional bias.
- Keep an eye on BTC/ETH ETF flow shifts as contextual risk sentiment evolves, especially BTC ETF inflows which may reinforce risk-on environments.
Hashtags: #ETH #Ethereum #MarketAnalysis #TechnicalAnalysis #ETFFlows #CryptoNews #TradingStrategy #RiskManagement #CryptoMarkets #PriceAction #Liquidity #MarketSentiment