Market Snapshot
As of January 16, 2026, Solana (SOL) is trading around $142.35. The broader market shows mixed signals with a slight risk-on bias indicated by positive ETF flows in Bitcoin and Ethereum. The current market environment features very low volatility and sideways momentum for SOL, with a neutral RSI and modest support-resistance levels.
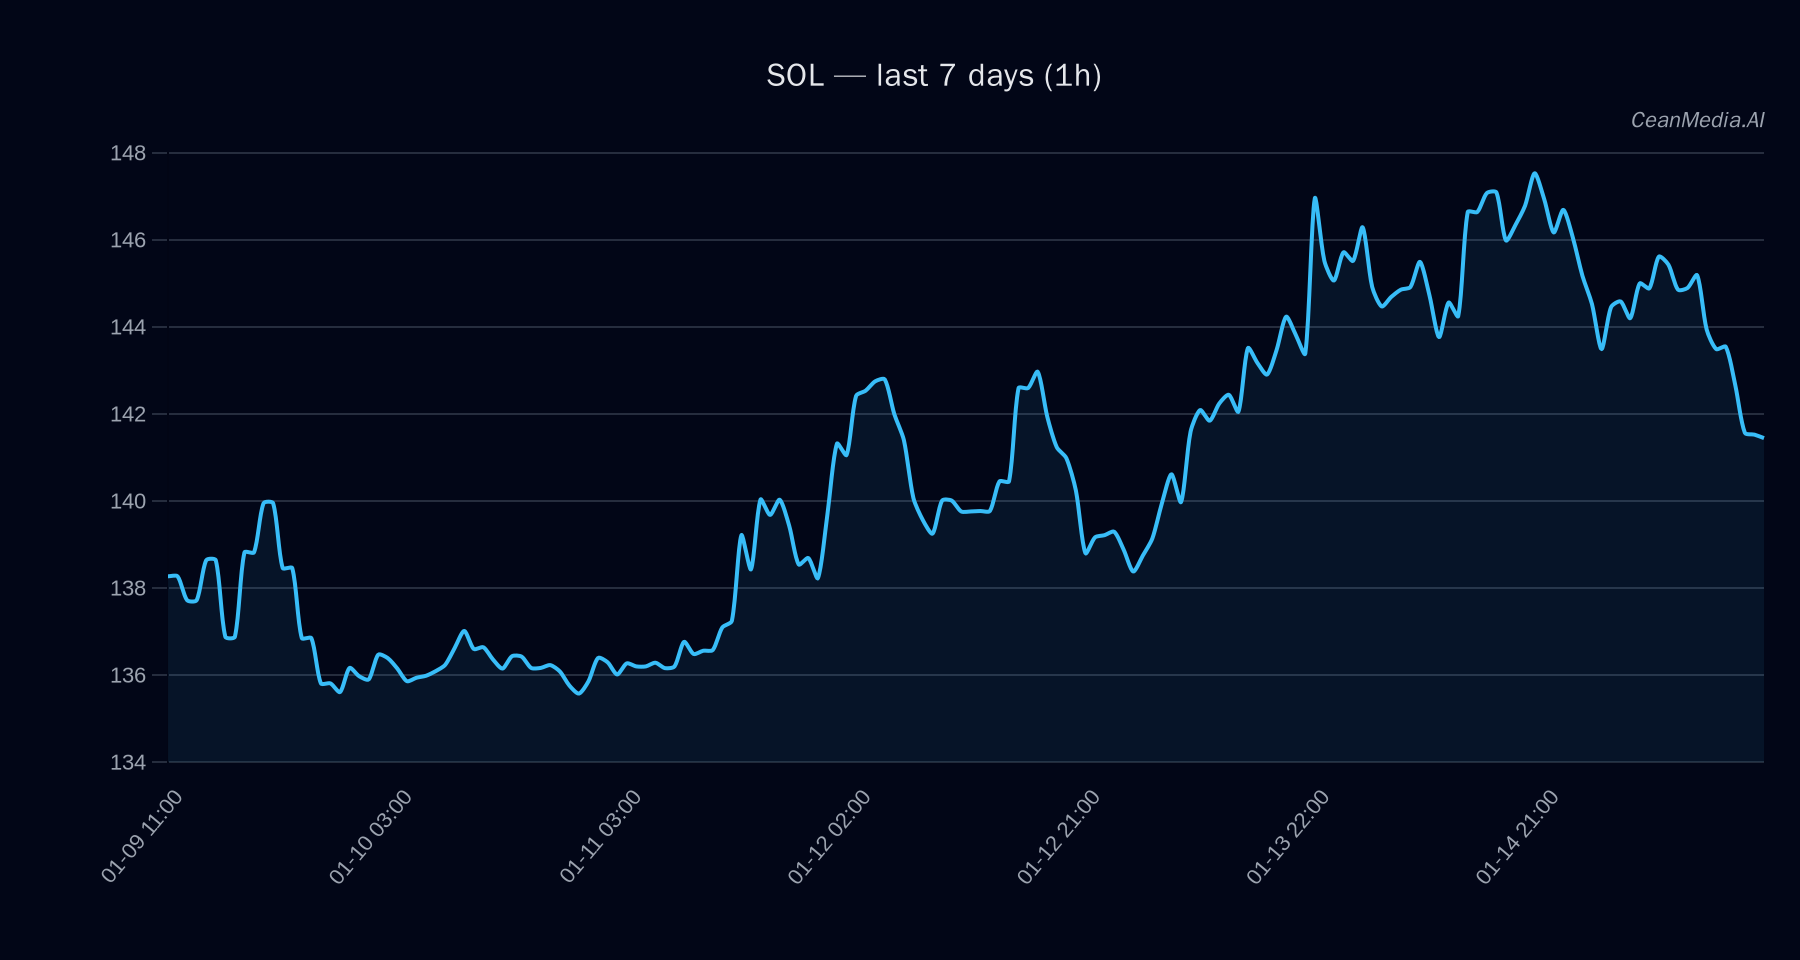
Technical Analysis: SOL
- Levels: Major support at approximately $134; near-term support at $140. Major resistance at $144; near-term resistance at $145.
- Bias: Sideways, with a slight downward tilt. The EMA12 is below EMA26, and the SMA50 remains above SMA200, indicating a cautious outlook.
- Triggers: Break above $145 could target $148.10–$151.00; a move below $140 may lead to $136.71–$133.92.
- Invalidation: A close above $145 would shift bias towards upside, while a close below $140 confirms downside risk.
Drivers
- Top factors: Return over 24 hours is near zero (-0.04%), and EMA slope remains negative (-0.0022), indicating limited short-term momentum.
- Market sentiment and volatility: Funding Z-score (-1.66) and Basis Z-score (-1.32) suggest slight bearishness, but overall volatility remains very low.
- Momentum: Trend strength is moderate (around 1.97), with no significant directional movement. Bitcoin’s 24-hour return is slightly negative (-0.02%), but its trend strength remains positive.
ETF Flows (BTC/ETH)
Recent ETF flows indicate a risk-on environment, with Bitcoin ETFs seeing inflows of +$192.2M over 1 day and +$287.6M over 5 days, and +$378.7M over 10 days. Ethereum ETFs also experience inflows, though more modest (+$93.5M over 1 day). These flows suggest increased institutional interest in risk assets, which can influence sentiment across the crypto market, including SOL. However, it is important to note that ETF flows in BTC and ETH are only contextual and do not serve as primary signals for SOL’s short-term direction.
What to Watch Next
- Monitor if SOL breaks resistance above $145 for a potential rally toward $148–$151.
- Observe if SOL drops below support at $140, which could accelerate downside towards $134 or lower.
- Keep an eye on Bitcoin and Ethereum ETF inflows as an indicator of overall market risk appetite.
- Watch for shifts in volatility and momentum indicators that could signal a change in trend bias.
Hashtags: #Solana #CryptoAnalysis #MarketUpdate #Bitcoin #Ethereum #ETFFlows #TechnicalAnalysis #CryptoNews #Blockchain #Investing #DigitalAssets #CryptoTrends