Market Snapshot
On January 17, 2026, LINK is trading around the $13.70 mark, with a short-term bias leaning towards downside. Recent data indicates a sideways trend with low volatility and neutral momentum. ETF flows show contrasting investor sentiment in Bitcoin and Ethereum, providing additional context for market dynamics.
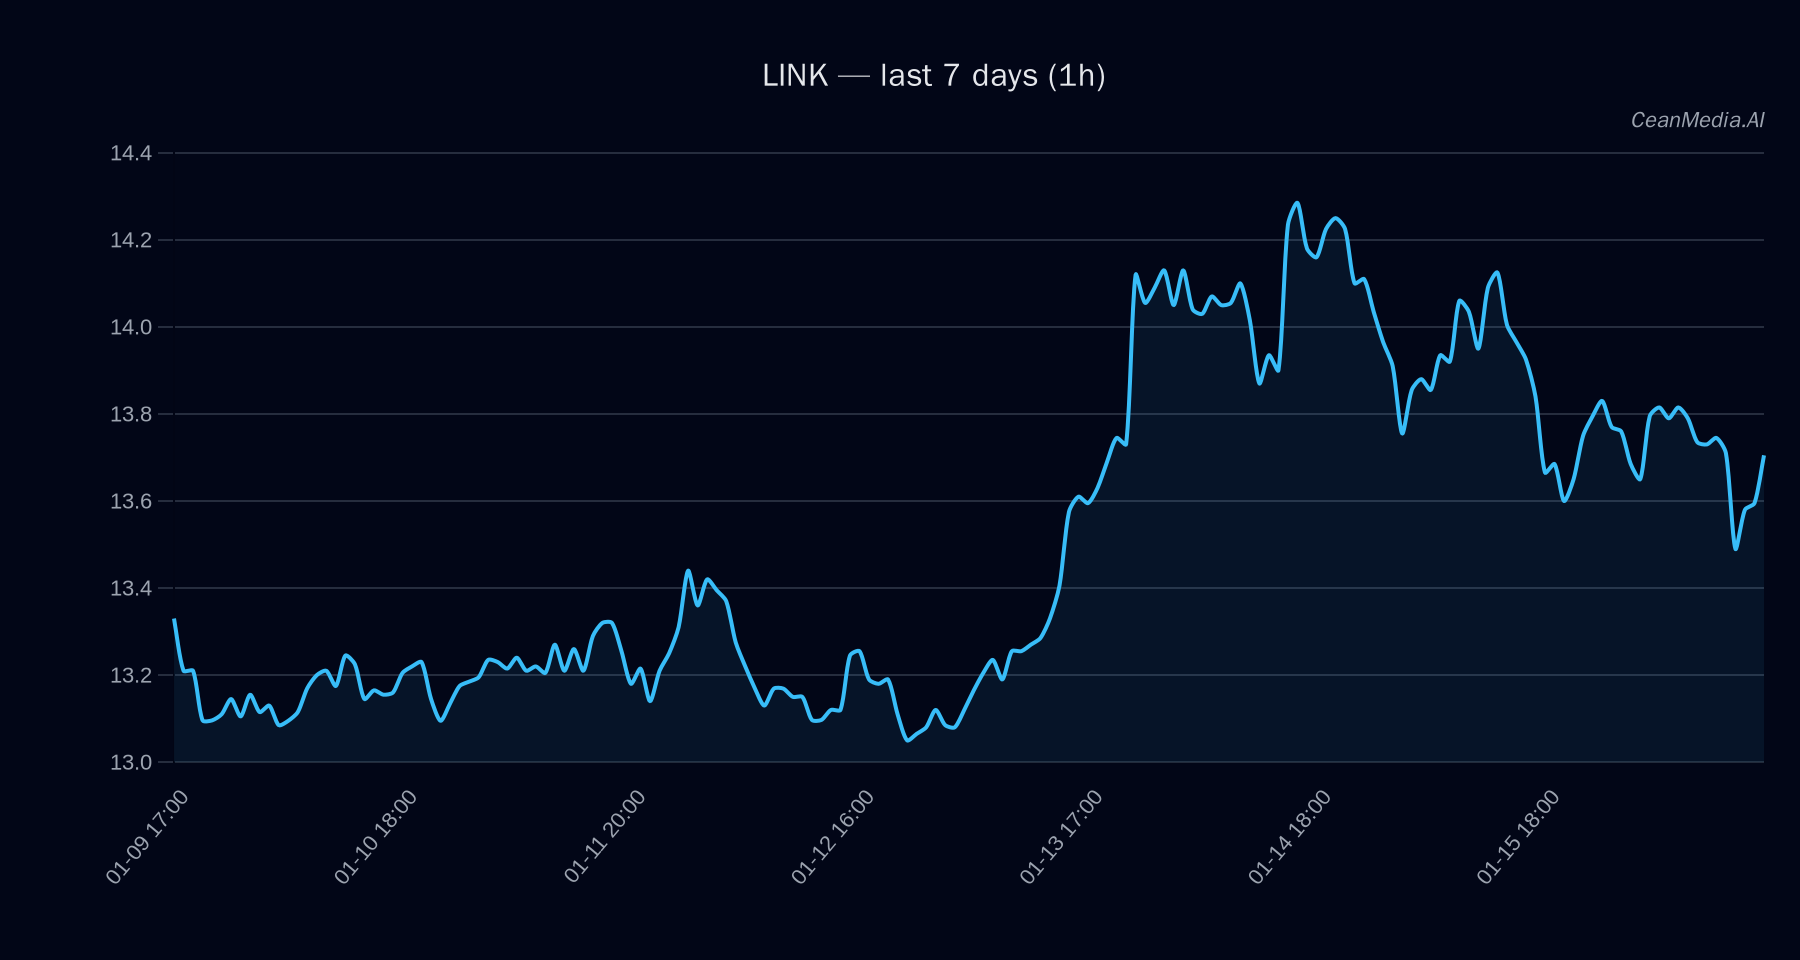
Technical Analysis: LINK
- Current Price: $13.70
- Support Levels: Major support at $12.40; near-term support at $13.40
- Resistance Levels: Major resistance at $13.90; near-term resistance at $14.00
- Forecast: 54% probability of downward movement within the next 24 hours, with key levels for potential breakout above $14.00 or breakdown below $13.40.
- Bias & Indicators: Technical conditions suggest sideways movement, with EMA12 below EMA26, SMA50 above SMA200, RSI at 47, and very low volatility regime. The market remains neutral with no immediate strong directional signals.
- Invalidation: A close above $14.00 would trigger a bullish move towards $14.25–14.53, while a close below $13.40 could lead towards $13.16–12.89.
Drivers
- Top Factors: Return over 24H at 0.77%, EMA slope positive but minimal, funding Z-score at -2.68 indicating slight negative funding bias, order-book imbalance slightly negative, and BTC returns modest at 0.32%.
- Momentum & Volatility: Trend strength remains moderate at 0.35, with very low 24-hour volatility. The market shows limited directional momentum, aligning with the sideways technical stance.
ETF Flows (BTC/ETH)
Recent ETF inflows show a divergence between Bitcoin and Ethereum. Bitcoin ETFs experienced a significant outflow of $26.7 million in the past day but accumulated a net inflow of approximately $700 million over 10 days, indicating cautious risk-off sentiment. Conversely, ETH ETFs saw a modest inflow of $15.2 million in one day, with positive flows over 5 and 10 days, suggesting a slightly more risk-on posture for ETH. These flows provide context but are not primary signals for LINK market direction.
What to Watch Next
- Monitor if LINK breaks above $14.00 for confirmation of bullish momentum.
- Watch for a decline below $13.40 to validate downside bias.
- Observe broader market sentiment and ETF flows for clues on risk appetite.
- Keep an eye on macro and liquidity conditions that could influence volatility and trend shifts.
Hashtags: #Crypto #LINK #MarketAnalysis #ETFFlows #Bitcoin #Ethereum #TechnicalAnalysis #CryptoTrading #MarketTrend #CryptoInsights #Investing #Blockchain