Market Snapshot
BTC trades around mid-76k to upper-77k range, with near-term setup showing a modest downside bias given the current price action and short-term forecast. The market context includes very low volatility and a dominance-driven backdrop, alongside ETF flow signals for BTC and ETH that provide supplementary context but are not primary signals for BTC direction.
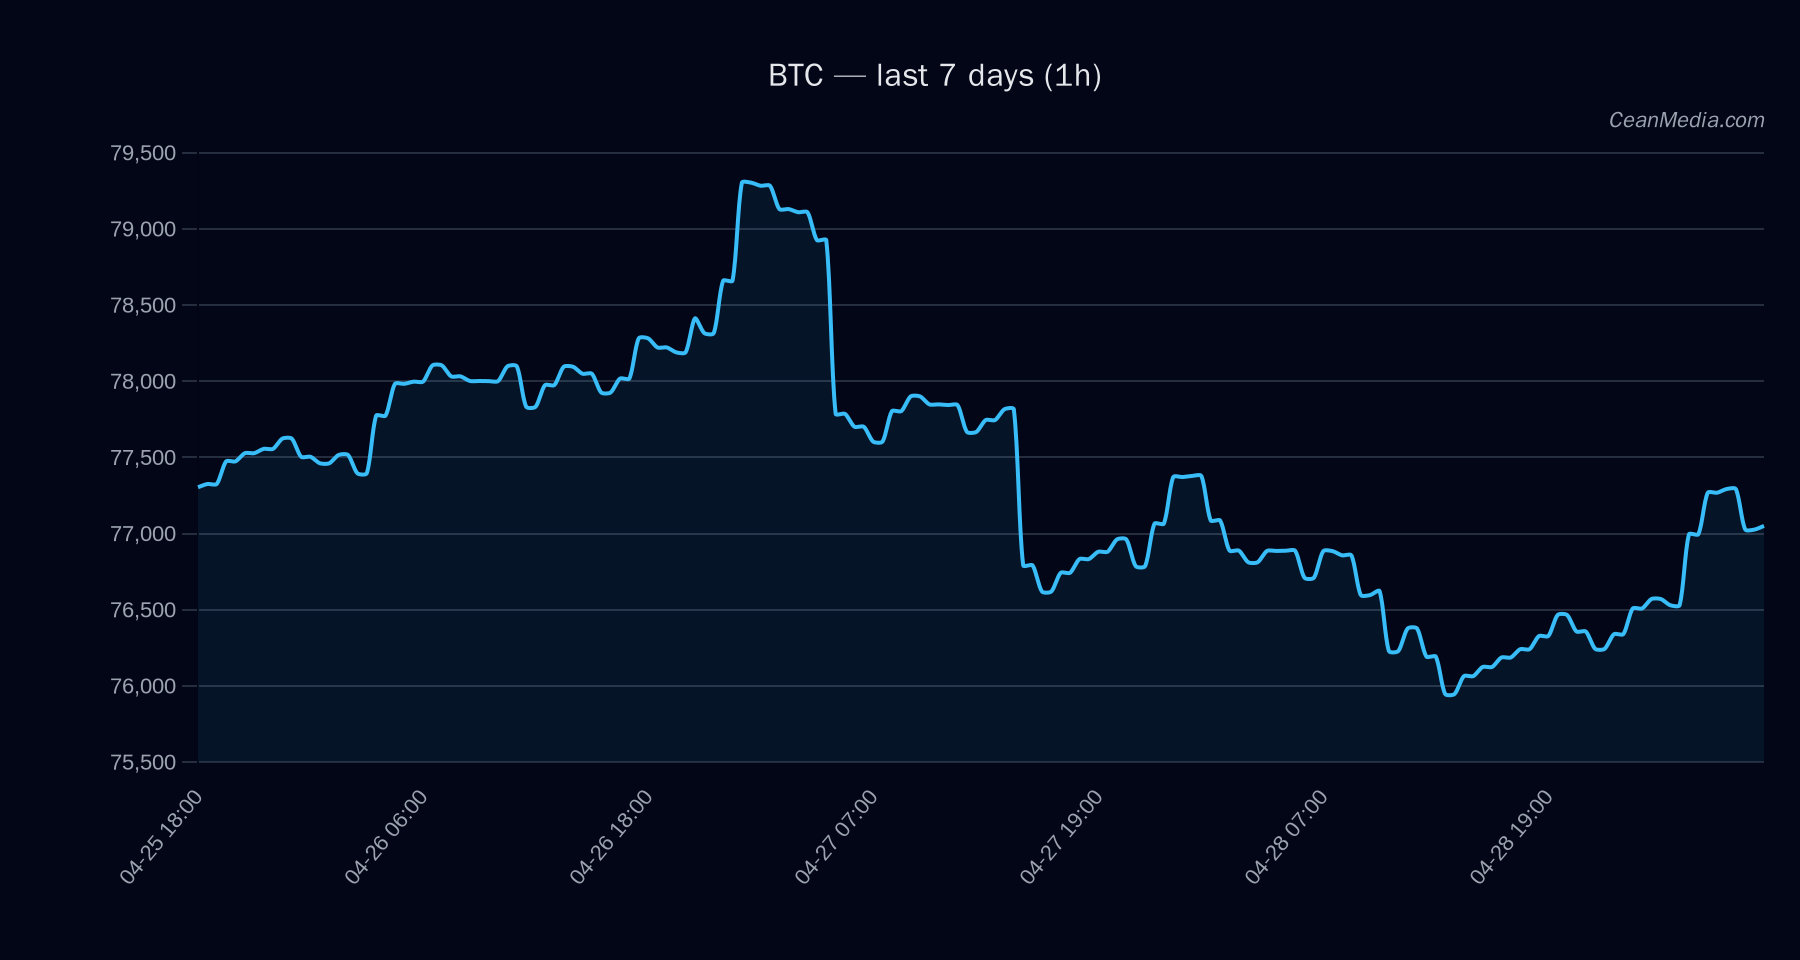
Technical Analysis: BTC
- Price: 77,036.67
- Short-Term Forecast: down (45%)
- Probabilities: Up 40%, Sideways 15%, Down 45%
- Indicators: EMA12>EMA26, SMA50
- Volatility & Regime: σ24h 0.24%, Vol regime: Very low
- Support / Resistance: Major Support 73,925; Near Support 75,500; Major Resistance 78,100; Near Resistance 78,575
- Projected Moves:
- Upside: If 1h close > 78,575, target 80,148.95 → 81,720.50
- Downside: If 1h close < 75,500, target 73,986.02 → 72,476.10
- Bias: Neutral to slightly bearish in the near term, given the current price within the defined band (P20–P80: 76,968.85 – 78,086.07).
- Key Levels: P50 77,255.43; Band: 76,968.85 – 78,086.07
- Top Drivers (selected): Stable MCAP LOG1P (contrib -1.16), BTC Dominance (contrib 0.81), EMA trend and delta metrics showing mixed signals. Net view aligns with a cautious stance into near term.
Drivers
- Top factors: Stable market capitalization signal, BTC dominance strength, EMA slope and basis z-scores, delta over 24h.
- Momentum: RSI at 58 indicates neutral momentum within a typical range; LS TOP Z-SCORE and SPREAD Z-SCORE contribute modestly to risk framing.
- Volatility: Very low regime supports range-bound tendencies in the near term.
- Consolidation context: Distance from MA (distance_from_ma ≈ -0.02% relative to recent average) suggests limited immediate trend impulse.
ETF Flows (BTC/ETH)
Contextual note: ETF flow data shown here covers BTC and ETH only and should be interpreted as macro risk-on/off indicators rather than primary signals for BTC price action. Current data shows mixed signals with BTC ETFs showing positive 1D flow and larger negative 5D flow, while ETH ETFs show net negative flows over the shorter horizon. This information adds to market sentiment but is not a sole driver for BTC price forecasts.
- BTC ETF Flows: 1 Day +$22.5M; 5 Day −$86.8M; 10 Day +$684.5M
- ETH ETF Flows: 1 Day −$8.6M; 5 Day −$67.4M; 10 Day +$214.5M
What to Watch Next
- Monitor close above 78,575 for a possible bullish extension toward 80,148–81,720.
- Watch for a break below 75,500 to validate downside targets around 73,986–72,476.
- Keep an eye on volatility regime and RSI movement for any shift into overbought/oversold conditions.
- Assess BTC dominance and macro risk sentiment as ETF flow trends may influence broad market behavior over multi-day horizons.
Hashtags: #Bitcoin #BTCAnalysis #MarketOutlook #ETFFlows #CryptoMarkets #TechnicalAnalysis #CryptoNews #PriceAction #Liquidity #MarketSentiment #CryptoTrading #AltDoms