Market Snapshot
As of January 17, 2026, LINK is trading at approximately $13.77. The recent technical signals suggest a sideways to slightly bearish bias, with a 54% probability favoring a downward move in the short term. The broader market sentiment is characterized by very low volatility and subdued trading activity, with the asset sitting between key support at $13.5 and resistance at $14.
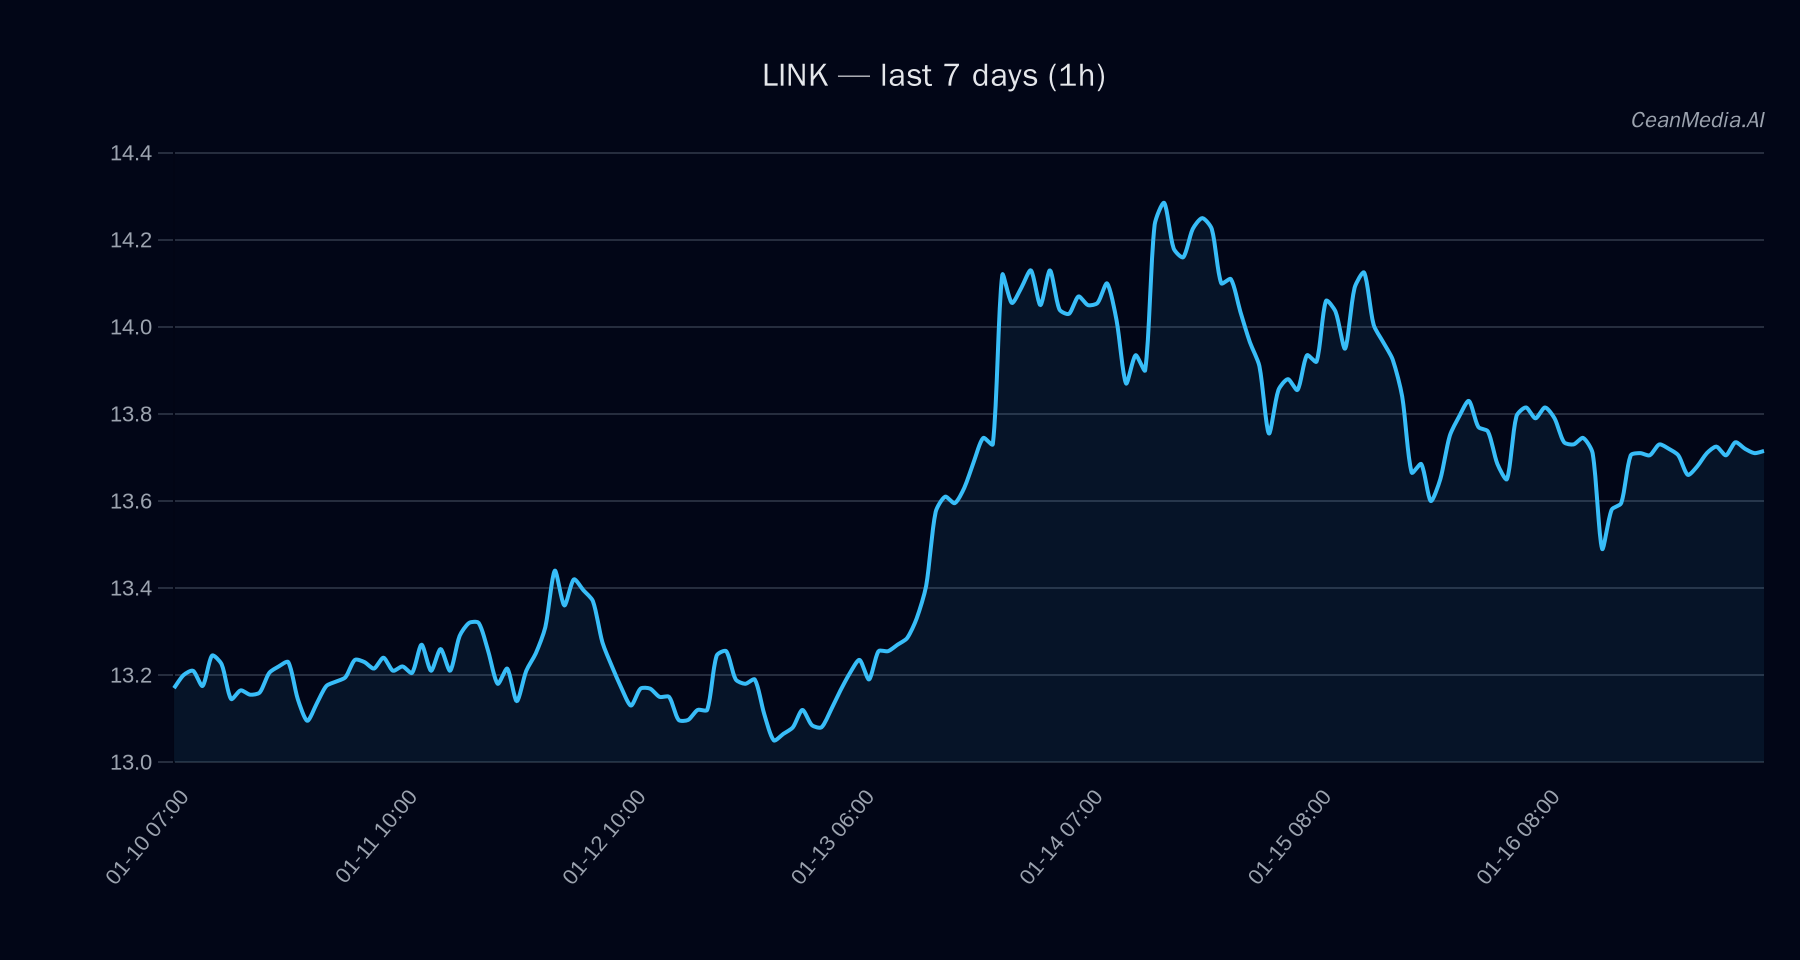
Technical Analysis: LINK
LINK currently trades at $13.77, positioned between a major support level at $13.5 and a resistance level at $14.00. The technical indicators point to a sideways trend, with the EMA12 below EMA26, SMA50 above SMA200, and the RSI at a neutral 54. The probability of a downward move within the next 24 hours is approximately 54%, with a potential downside target near $13.22, and an upside target above $14 if a breakout occurs. The current market environment shows very low volatility (σ24h 0.43%) and minimal order-book imbalance, indicating limited directional momentum.
Drivers
- Return 24H: Slight negative at -0.22%
- EMA Slope: Neutral, marginally positive at 0.0001
- Funding Z-Score: Slightly bullish at 0.18
- Basis Z-Score: Slightly bearish at -0.27
- Order Book Imbalance (EMA5): Slight buy-side pressure at 0.2
- BTC Return 24H: Slight negative at -0.21%
- BTC Volatility Regime: Very low, indicating subdued market activity
- BTC Trend Strength: Weak at 0.2
The overall momentum remains neutral, with no strong drivers indicating a clear directional bias at this time.
ETF Flows (BTC/ETH)
Recent ETF flows show mixed signals: Bitcoin ETFs saw a significant outflow of approximately $410 million over the past day but experienced inflows of nearly $500 million over the past five days. Ethereum ETFs, on the other hand, saw modest daily outflows of around $10 million but accumulated inflows totaling $175 million over five days. These flows suggest a cautious risk-on/off environment, with some investors reallocating between assets, though these are only context and not primary signals for LINK.
What to Watch Next
- Monitor for a breakout above $14 for potential bullish confirmation.
- Watch for a breakdown below $13.5 to validate further downside risk.
- Keep an eye on overall market volatility and ETF flow trends for broader risk sentiment shifts.
- Observe the development of technical indicators for any signs of increased momentum or divergence.
Hashtags: #Crypto #LINK #TechnicalAnalysis #MarketUpdate #BTC #ETH #ETFFlows #CryptoAnalysis #Trading #Investing #MarketTrends