Market Snapshot
On 2026-04-22, SOL is trading around the mid-to-upper 80s, with near-term resistance noted at 87.4 and a major resistance at 89.1. The immediate support sits at 80.9, with a critical near-term level at 85.6. The price is within a defined range, and the 1-hour momentum suggests a potential upside breakout if price closes above 89.1, with an inferred target in the 90.92–92.70 area. Breadth indicators show strong participation in the broader market, while volatility remains very low.
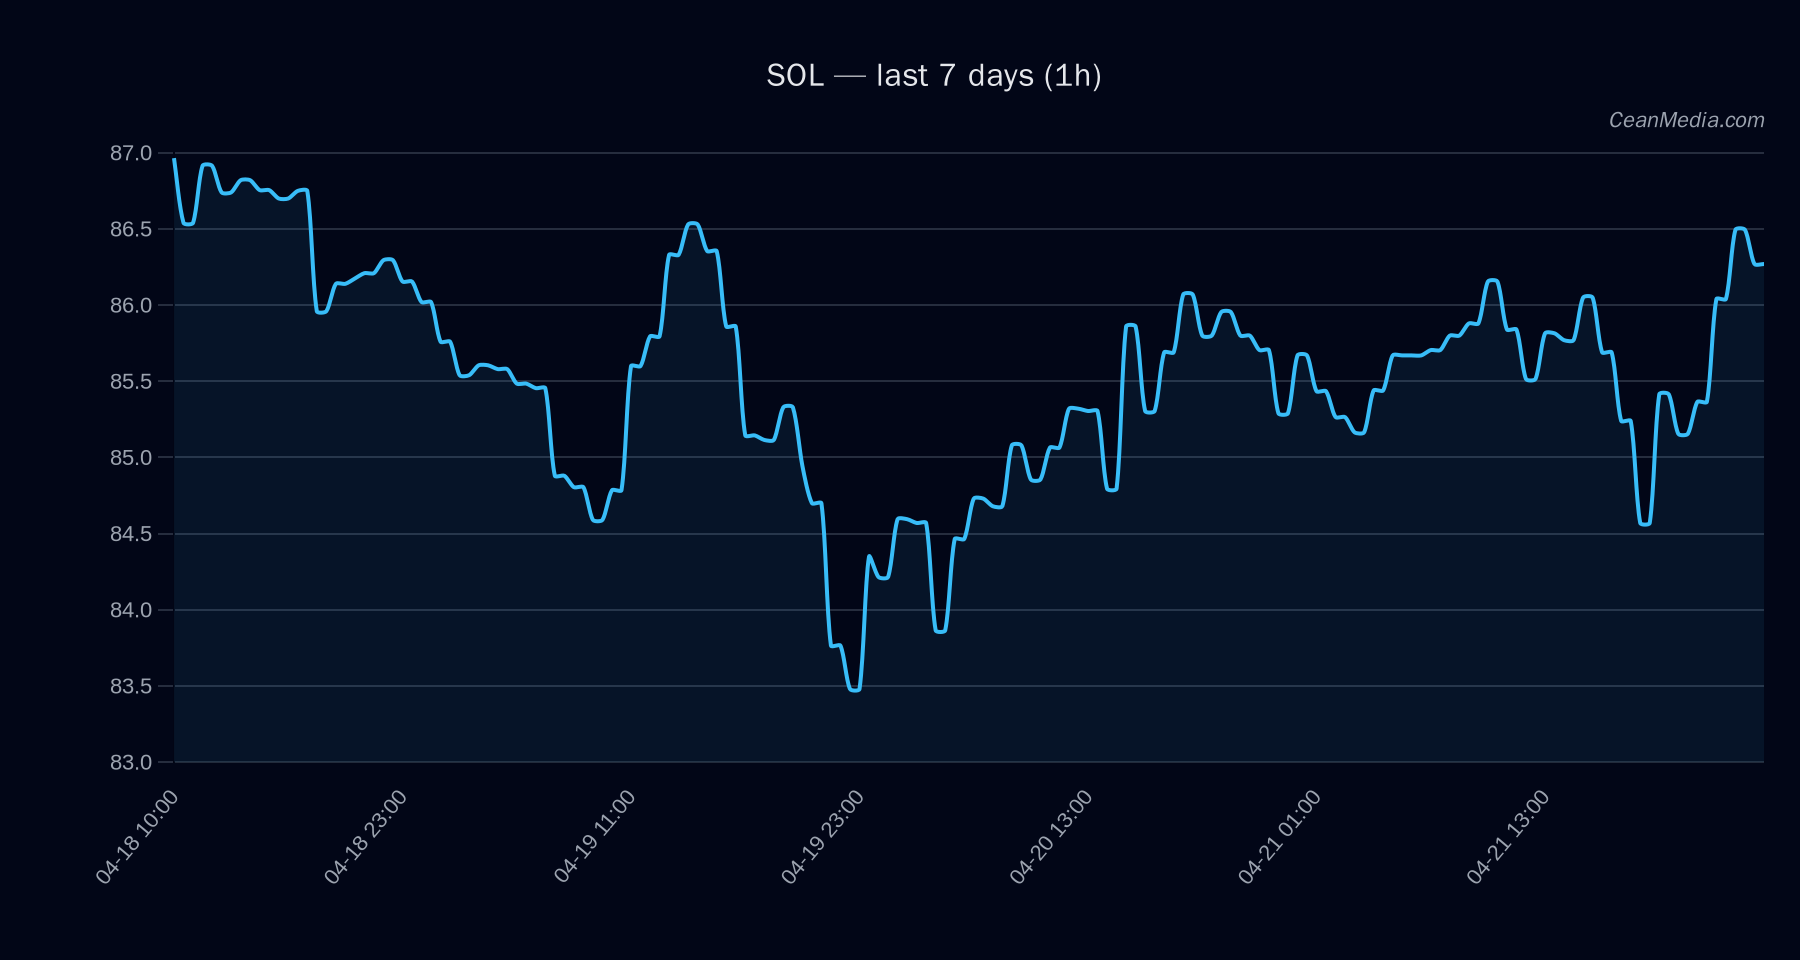
Technical Analysis: SOL
Current levels: Price 87.39; Support: 80.9 (major), 85.6 (near); Resistance: 87.4 (major), 89.1 (near).
- EMA12 > EMA26 and SMA50 < SMA200 indicate a mixed bullish bias on trend filters, complemented by RSI at 66.
- Volatility: σ24h = 0.45% with a very low vol regime, supporting a narrow trading range.
- Forecast/Bias: Up with a 52% probability in the near term; overall TA indicates sideways tendencies within the current band.
Traders’ triggers:
- Upside trigger: 1h close above 89.1 targets ~90.92–92.70.
- Downside trigger: 1h close below 85.6 targets ~83.93–82.22.
Invalidation considerations: If price breaks decisively below 80.9 or above 92–93, the current range thesis may be invalidated and a new directional framework could emerge.
Drivers
- Top drivers: Return 24h, EMA slope, funding Z-score, basis Z-score, and order-book imbalance (EMA5).
- Momentum: Trend strength measured around 0.48; breadth signals are positive; BTC correlation (72h) is strong at 0.88, indicating high co-movement with BTC for the near term.
- Volatility regime: Very low, suggesting consolidation and reduced breakout potential in the immediate term.
ETF Flows (BTC/ETH)
The ETF flow context presented focuses on BTC and ETH only. BTC shows substantial positive ETF flows: +$238.4M today, +$1.18B over 5 days, and +$1.45B over 10 days. ETH also shows inflows: +$75.3M today, +$295.5M over 5 days, and +$408.7M over 10 days. These data points indicate a risk-on environment under consideration, with broad institutional demand for BTC/ETH-based products.
Important note: ETF data here is contextual and serves as a market sentiment backdrop. It is not a primary signal for SOL directly, but it can influence correlated assets and overall risk appetite.
What to Watch Next
- Monitor SOL price action around 89.1 for potential breakout confirmation.
- Watch for a daily close beyond 89.1 or a sustained move below 85.6 to confirm the next directional bias.
- Observe BTC/ETH ETF flow momentum as a risk-on/off indicator that may impact liquidity conditions for SOL.
- Keep an eye on volatility regime and any shift from Very low to higher regimes, which could precede breakout activity.
Hashtags: #Solana #SOL #CryptoAnalysis #TechnicalAnalysis #ETFFlows #BTC #ETH #MarketSnapshot #TradingStrategy #CryptoMarkets #PriceAction
Note: ETF data is BTC/ETH-only and provided for contextual market sentiment. It should not be used as a sole signal for SOL trading decisions.