Market Snapshot
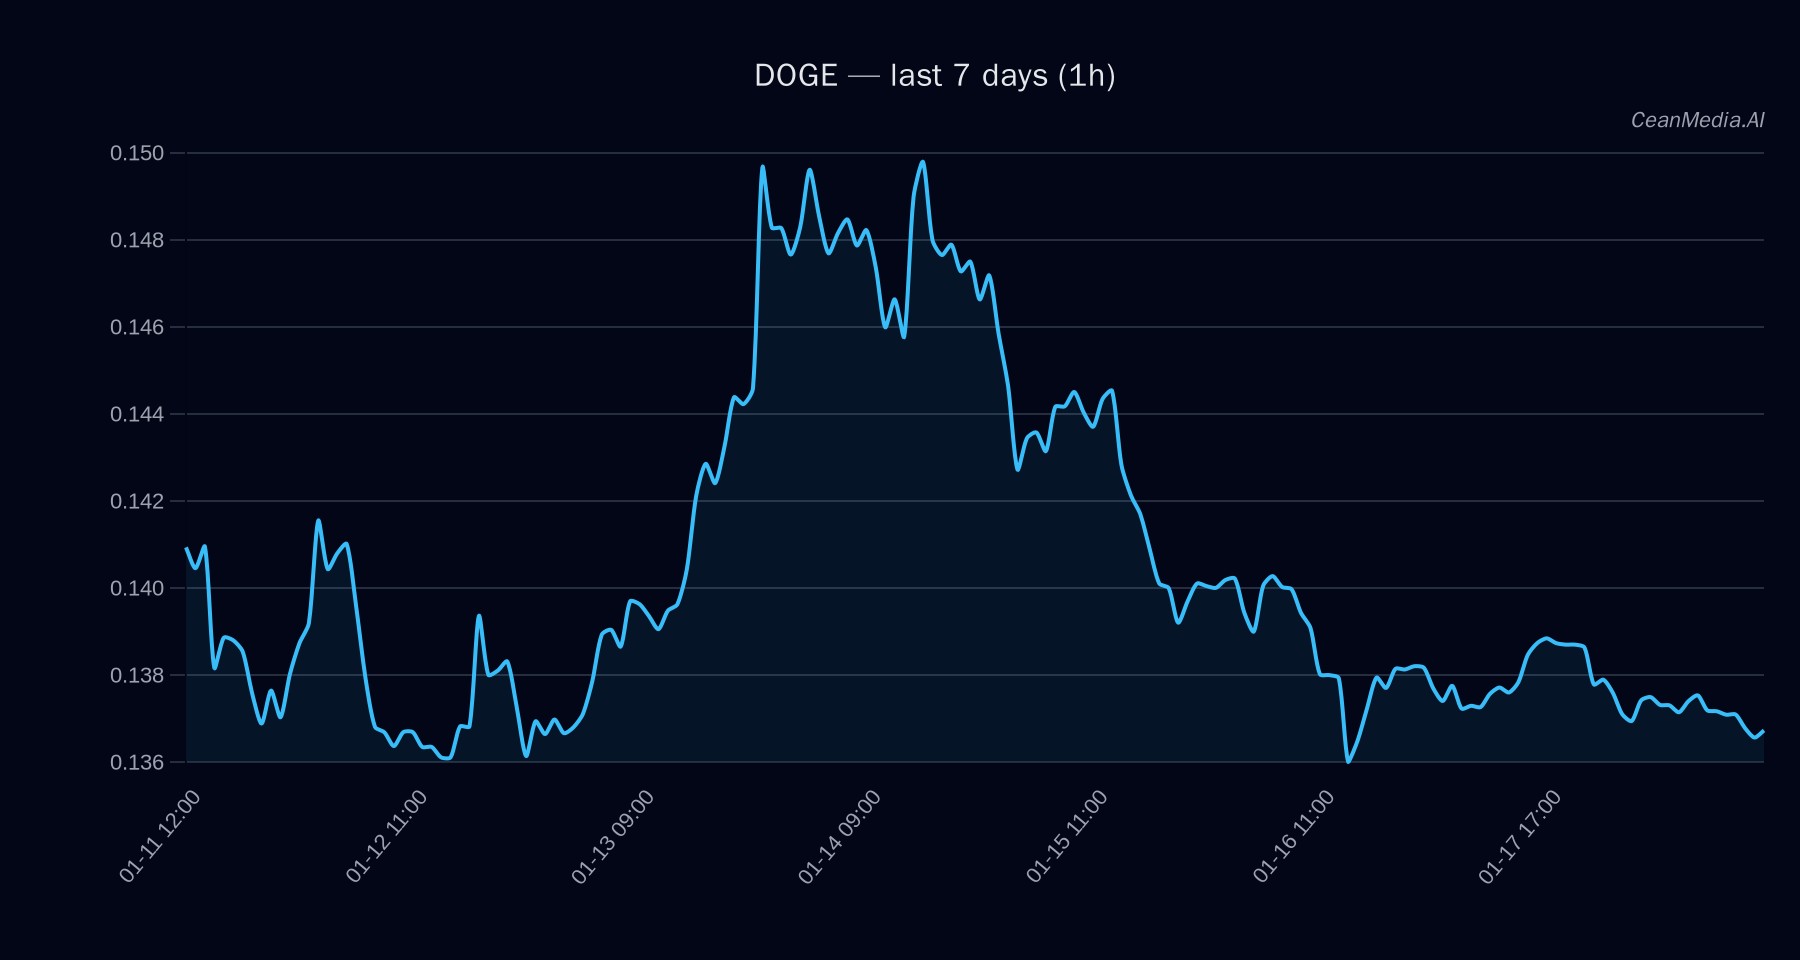
On January 18, 2026, Dogecoin (DOGE) trades around 0.1374 USD. The current market environment is characterized by very low volatility with a slight bearish tilt, supported by technical indicators and broader market flows. The asset remains within a defined support and resistance zone, with key levels at 0.135 USD and 0.14 USD respectively.
Technical Analysis: DOGE
Dogecoin’s technical landscape indicates a bearish bias, with the short-term moving averages confirming downward momentum (EMA12 Overall, the technical drivers suggest a cautious, slightly bearish momentum for DOGE, with low volatility and limited directional strength. Recent ETF flow data for Bitcoin and Ethereum indicate a risk-off environment: Bitcoin ETFs saw a net outflow of approximately $394.7 million over the past day, though inflows over the 5-day period offset this slightly. Conversely, ETH ETFs experienced consistent inflows, totaling around $4.7 million daily and maintaining positive flows over 5 and 10 days. While these flows primarily reflect broader market sentiment and risk appetite, they serve as contextual indicators rather than direct signals for DOGE. The subdued ETF activity suggests cautious investor sentiment in the crypto space overall. Hashtags: #Dogecoin #CryptoAnalysis #TechnicalAnalysis #BTC #ETH #MarketSentiment #CryptoFlows #Altcoin #CryptoTrading #Volatility #MarketUpdateDrivers
ETF Flows (BTC/ETH)
What to Watch Next