Market Snapshot
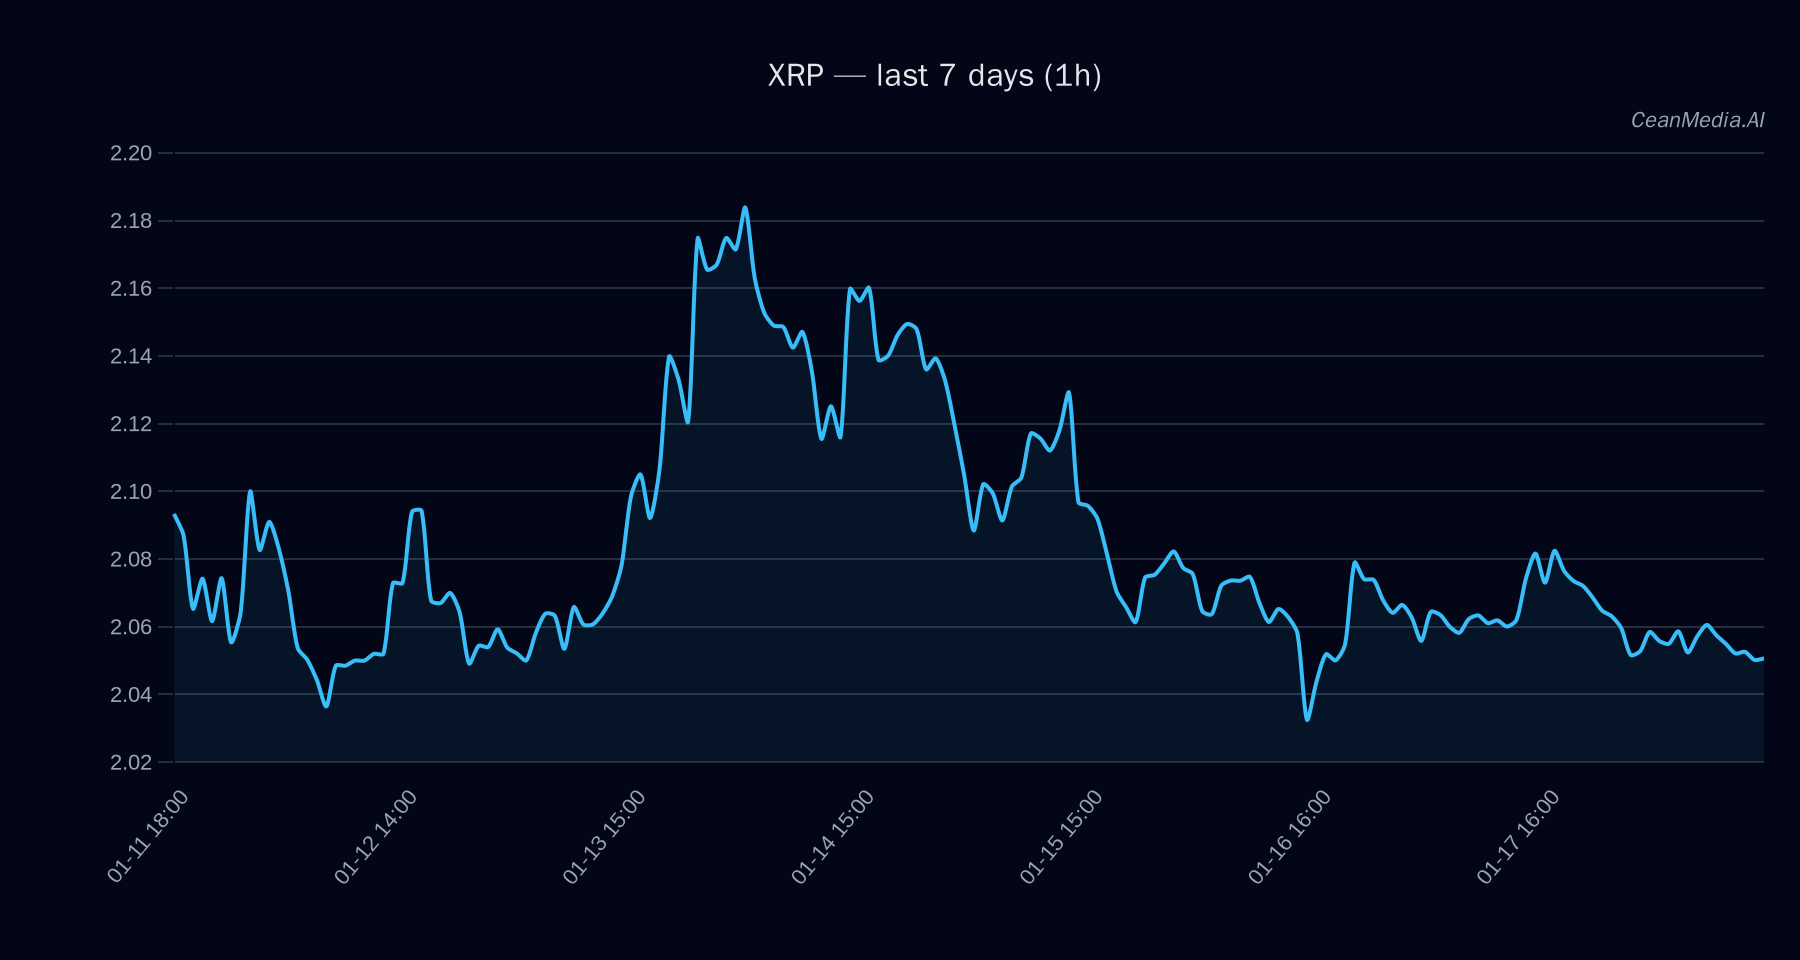
On January 18, 2026, XRP is trading around $2.05, situated between key support at $2.00 and resistance at $2.10. The broader market shows mixed signals, with Bitcoin and Ethereum ETFs experiencing notable inflows and outflows, indicating a cautious risk environment. The overall sentiment for XRP remains bearish in the short term, but technical levels suggest potential for upward movement if key resistance is breached.
Technical Analysis: XRP
XRP’s current price sits at approximately $2.05, with the asset trading within a defined support zone at $2.00 and resistance at $2.10. The short-term forecast indicates a 47% probability of upward movement, but the technical indicators are bearish: the EMA12 is below EMA26, and the SMA50 remains below SMA200, signaling ongoing bearish momentum. RSI stands at 46, reflecting neutral momentum, and the volatility regime is very low, suggesting subdued market activity.
Key levels to watch include:
- Support: Major at $2.00, near-term at $2.02
- Resistance: Major at $2.24, near-term at $2.10
If XRP breaks above $2.10, a potential rally to approximately $2.14–$2.18 could occur. Conversely, a decline below $2.02 could see prices drop toward $1.93–$1.97, invalidating the bullish scenario.
Drivers
- 24H Return: -0.01, indicating slight short-term downward pressure
- EMA Slope: Negative at -0.0004, supporting bearish momentum
- Funding Z-Score: -0.93 and Basis Z-Score: -0.86, suggest neutral to slightly negative funding conditions
- Order Book Imbalance (EMA5): -0.11, indicating marginal selling pressure
- Bitcoin 24H Return: -0.0048, reflecting a minor decline in correlated assets
- Market Volatility Regime: Very low, implying subdued trading activity
Market breadth remains below 50%, and the correlation with Bitcoin over 72 hours is relatively strong at 0.69, indicating that Bitcoin trends continue to influence XRP movements.
ETF Flows (BTC/ETH)
Current ETF flows highlight a risk-off environment: Bitcoin ETFs have experienced a significant outflow of approximately $395 million over the last day, while Ethereum ETFs have seen inflows totaling nearly $5 million. Over the past five days, Bitcoin ETFs have gained around $515 million, but the recent outflow signals caution. Conversely, Ethereum ETFs show consistent inflows, suggesting a slight shift towards altcoins and a cautious stance among investors. These flows provide context but are not primary signals for XRP trading decisions.
What to Watch Next
- Monitor XRP’s ability to break above $2.10 for potential bullish continuation
- Watch for a decline below $2.02 that could invalidate the short-term bullish bias
- Observe broader market sentiment and ETF flows for clues on risk appetite
- Keep an eye on Bitcoin and Ethereum ETF trends as context for market risk sentiment
Hashtags: #Crypto #XRP #MarketAnalysis #TechnicalAnalysis #ETFFlows #Bitcoin #Ethereum #Altcoins #RiskOn #RiskOff #CryptoTrading #MarketUpdate