Market Snapshot
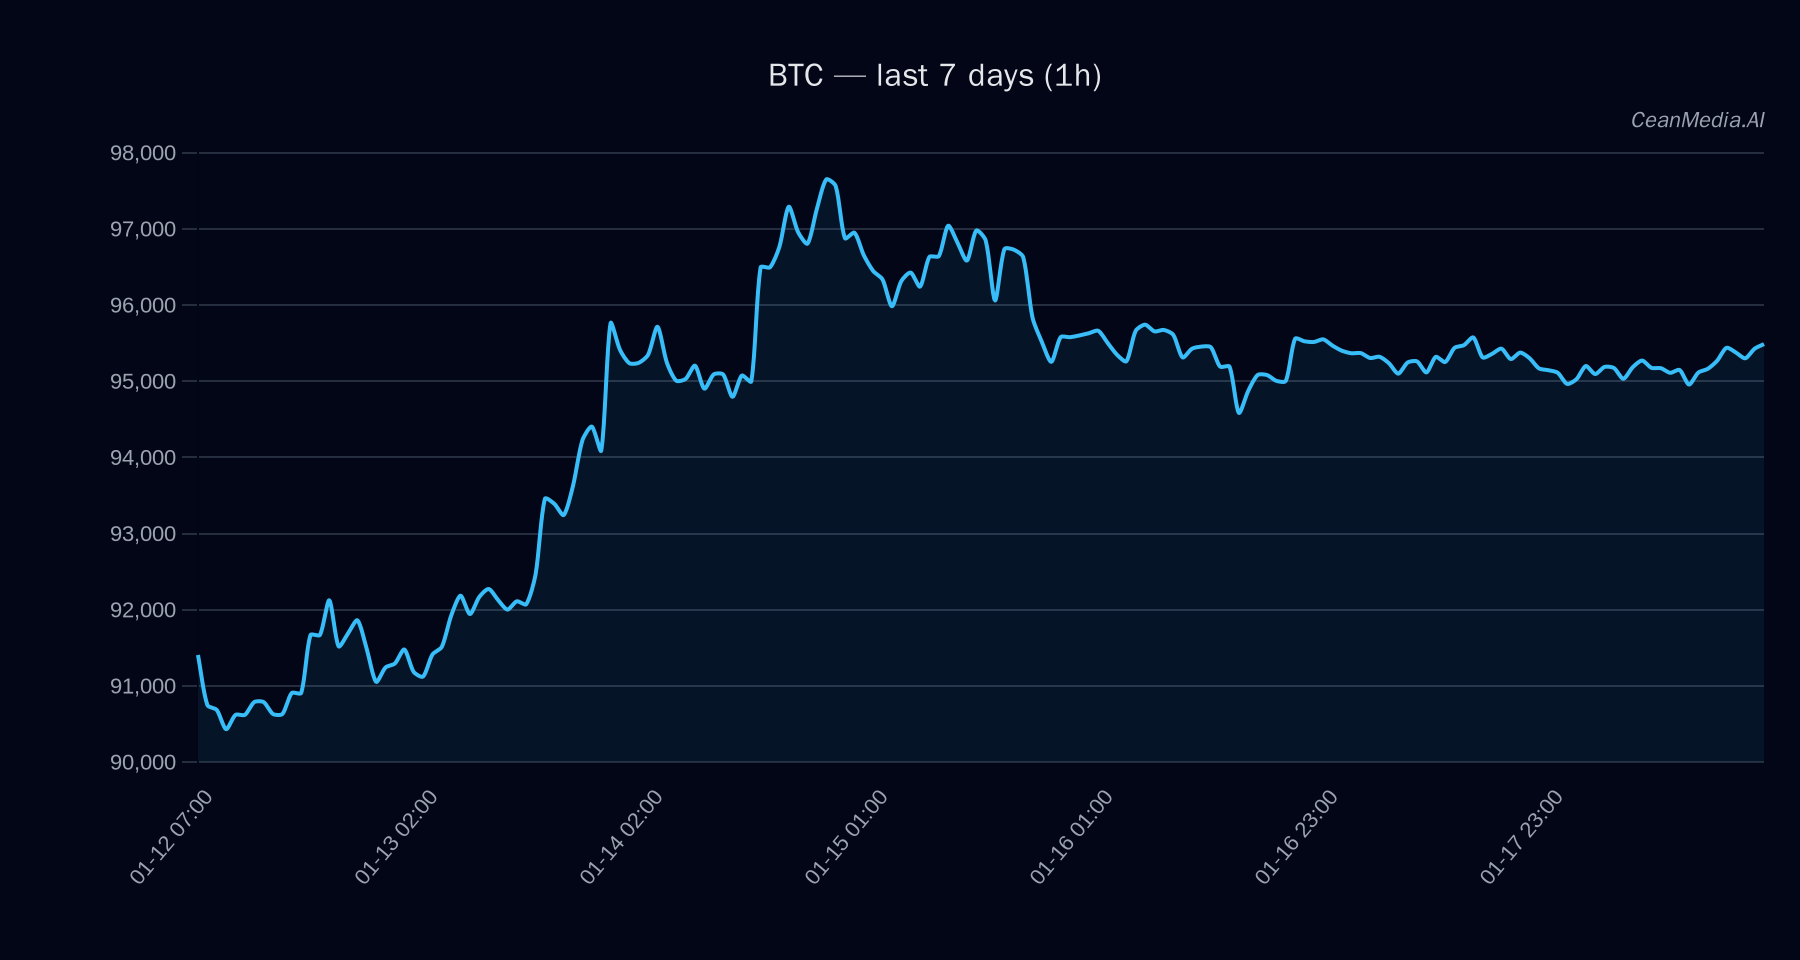
Bitcoin (BTC) is currently trading around the $94,888 level, with a short-term outlook indicating a predominantly sideways movement. The market exhibits very low volatility, and technical indicators suggest a cautious stance with a slight bias towards downside risk. ETF flows for BTC and ETH show mixed signals, adding context to the current market environment.
Technical Analysis: BTC
- Levels: Support is identified near $93,000 (major support) with resistance around $96,775 (major resistance). Break above resistance could target $98,721 to $100,657, while a break below support may lead to $91,130 to $89,270.
- Bias & Triggers: The current technical landscape favors a sideways to slightly bearish bias, with a 49% probability of downside movement within the next 24 hours. The EMA12 is below EMA26, and the RSI is at 40, indicating neutral momentum.
- Invalidation: A close above $96,775 would trigger an upward move towards $98,721–$100,657. Conversely, a close below $93,000 could see prices decline to $91,130–$89,270.
Drivers
- Top Factors: The 24-hour return remains near zero, with minimal momentum shifts. The EMA slope and funding Z-score point to a very cautious environment, while the spread and order book imbalance suggest limited immediate directional conviction.
- Momentum & Volatility: The market exhibits very low volatility (σ24h: 0.16%) and a neutral trend strength indicator. ETF flows show a recent net outflow from BTC, but inflows into ETH hint at a risk-on sentiment in altcoins.
ETF Flows (BTC/ETH)
Recent ETF data reveals a net outflow from Bitcoin ETFs over the last 1 day, totaling approximately -$395M, while over 5 days, inflows reached +$515M. ETH ETFs experienced modest inflows of +$4.7M in 1 day and +$190M over 5 days. This suggests a nuanced risk environment where investors are rotating into altcoins, possibly reflecting a cautious stance on BTC despite overall capital inflows into crypto ETFs.
What to Watch Next
- Monitor the key support at $93,000 and resistance at $96,775 for breakout signals.
- Observe ETF flow trends in BTC and ETH for shifts in risk appetite.
- Watch for a close above or below critical levels to confirm directional bias.
- Keep an eye on volatility and momentum indicators for early signs of market shifts.
Note: ETF flow data is limited to BTC and ETH and serves as supplementary context rather than a primary trading signal.
Hashtags: #Bitcoin #CryptoAnalysis #BTC #ETFs #MarketUpdate #CryptoTrading #TechnicalAnalysis #CryptoFlows #Altcoins #MarketSentiment #CryptoNews #FinancialAnalysis