Market Snapshot
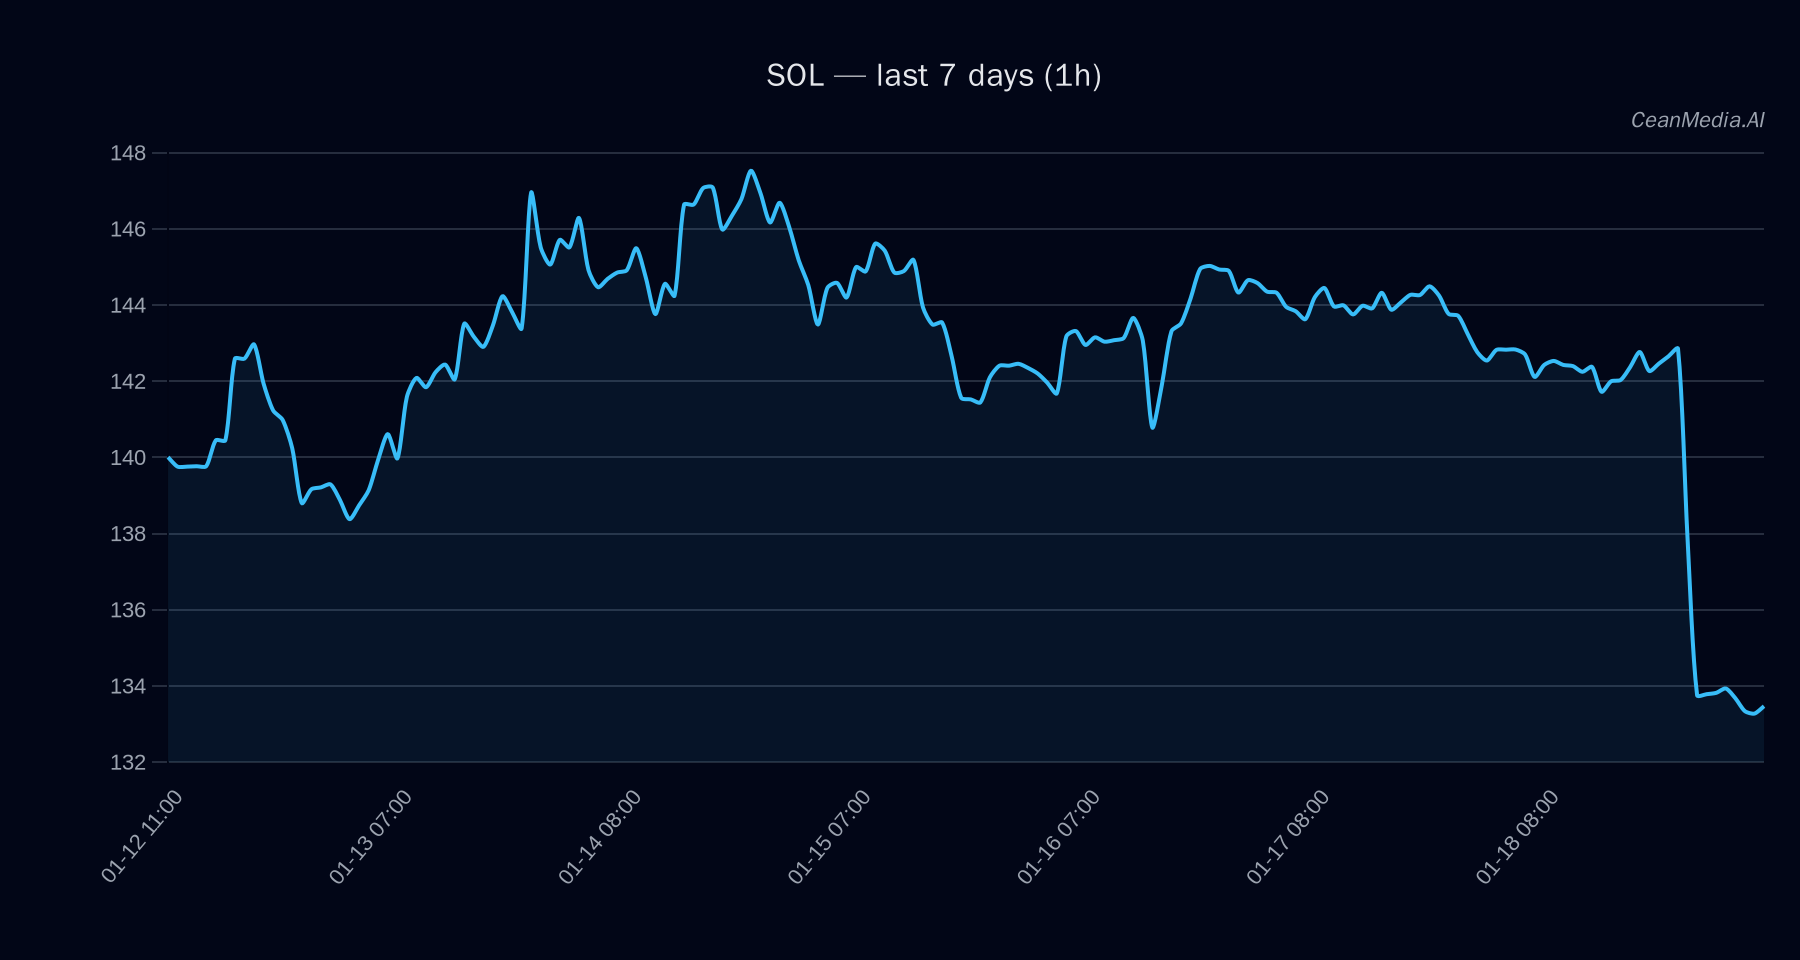
As of January 19, 2026, Solana (SOL) is trading at approximately $133.76. The market sentiment remains bearish with a short-term forecast indicating a 49% probability of downside movement. The broader crypto market shows mixed signals, with Bitcoin experiencing slight declines and stable ETF flows in ETH suggesting some risk-on sentiment in traditional markets.
Technical Analysis: SOL
Solana is currently positioned between key support and resistance levels, with major support at $131 and resistance at $136. A break above $136 could target the next resistance zone around $139.16 to $141.89, while a decline below $131 could see prices fall to approximately $125.84 to $128.46. The technical indicators point to a bearish bias, with EMA12 below EMA26, and the SMA50 below SMA200, confirming downward momentum. The RSI is at an oversold level of 19, suggesting potential for a short-term bounce, but the prevailing trend remains downward.
Drivers
- Return 24H: -0.07
- EMA Slope: -0.0038
- Funding Z-Score: -0.44
- Basis Z-Score: -0.32
- Order-Book Imbalance (EMA5): -0.02
- BTC Return 24H: -0.03
- Market Volatility Regime: Very low, indicating subdued trading activity
- Market Sentiment (Fear & Greed Index): 44, leaning towards fear
- Bitcoin Dominance: 57.5%, rising slightly over the past week
The top drivers suggest a cautious market environment with limited upside momentum and persistent downside pressure, reinforced by the oversold RSI and negative EMA slope.
ETF Flows (BTC/ETH)
Current ETF flows show a divergence: Bitcoin ETFs have experienced a significant outflow of approximately $394.7 million in the past day, although there have been inflows over the past 5 and 10 days. Conversely, Ethereum ETFs have seen consistent inflows, totaling around $4.7 million in the last day and positive flows over the past week. While these ETF flows are primarily in BTC and ETH and serve as a broader market context, they may reflect a cautious risk-on/off sentiment environment that could influence altcoin movements, including SOL.
What to Watch Next
- Monitor for a breakout above $136 to confirm potential short-term recovery towards $139.16–$141.89.
- Watch for a decline below support at $131, which could accelerate downside toward $125.84–$128.46.
- Observe BTC and ETH ETF flows for signs of risk appetite shifts that may impact SOL indirectly.
- Keep an eye on overall market volatility and sentiment indicators for cues on trend reversals.
Note: ETF flow data pertains only to BTC and ETH and provides contextual insight rather than direct signals for SOL price movements.
Hashtags: #Solana #CryptoAnalysis #MarketUpdate #BTC #ETH #ETFFlows #TechnicalAnalysis #Altcoins #CryptoTrends #InvestmentInsights #Blockchain