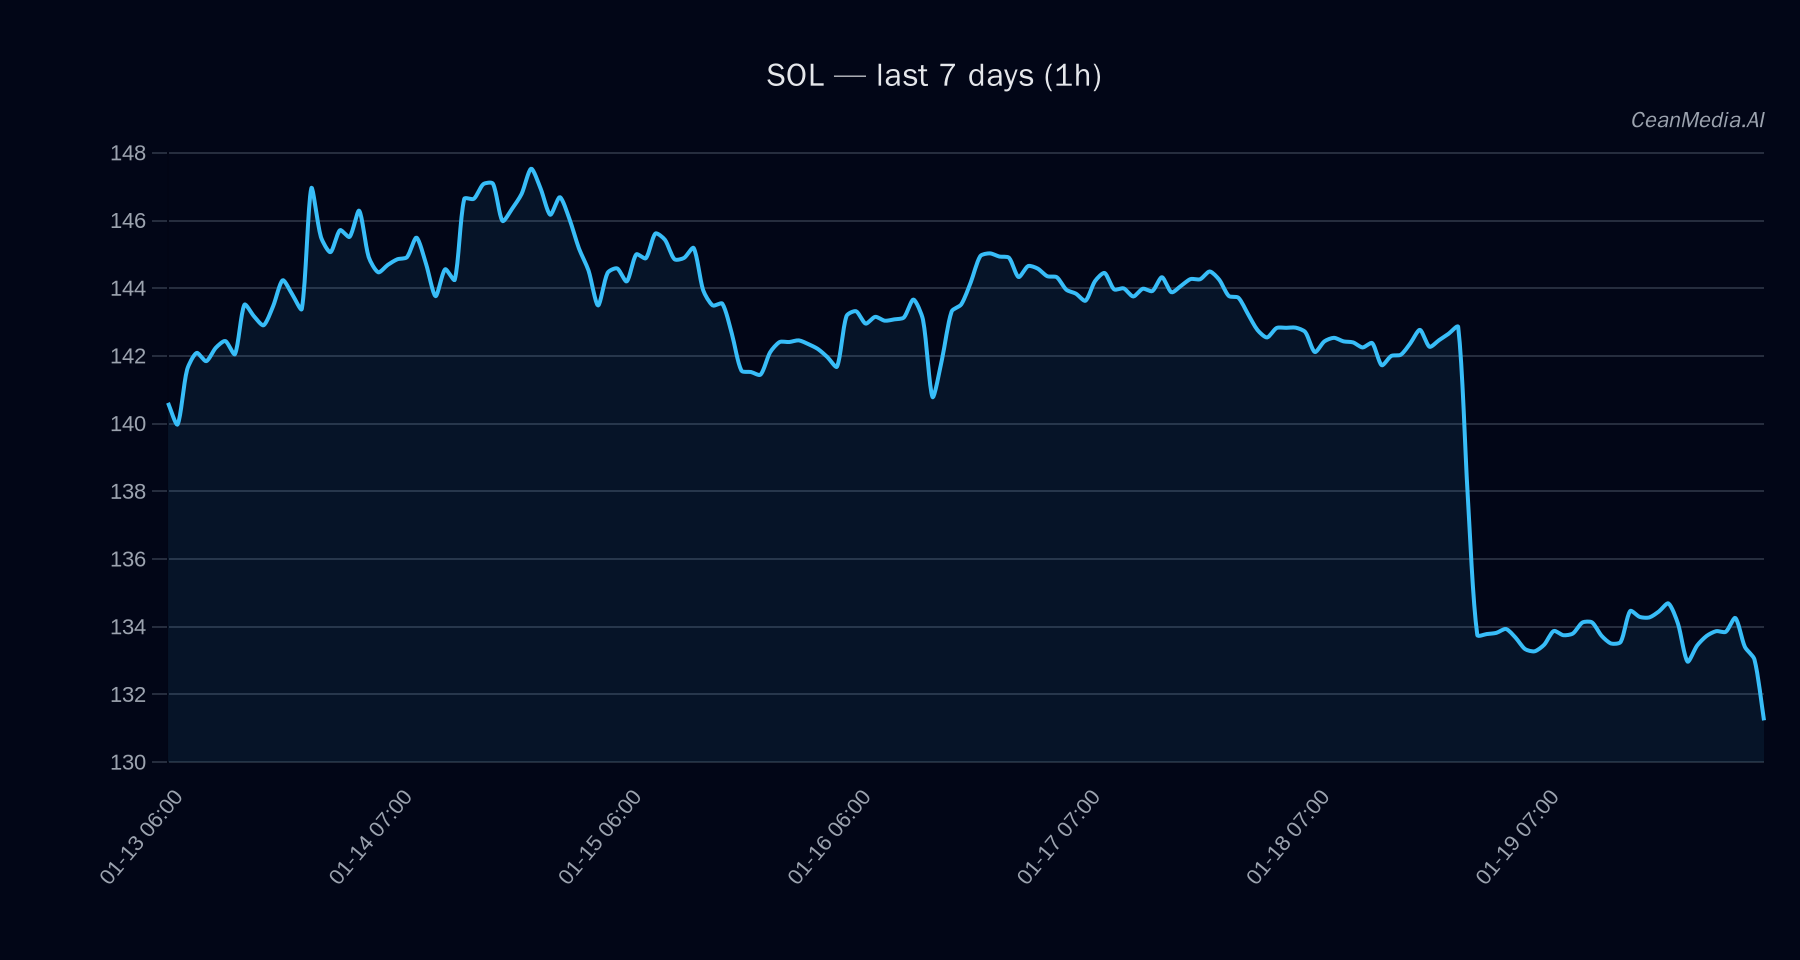
Market Snapshot
On January 20, 2026, Solana (SOL) trades around $131.26, with a short-term bearish bias indicated by technical signals. Market sentiment remains cautious amid very low trading volume and oversold RSI levels. Meanwhile, ETF flows highlight contrasting investor activities in Bitcoin and Ethereum, providing additional context for risk appetite.
Technical Analysis: SOL
Solana currently sits between key support at approximately $129 and resistance at around $134. A break above $134 could target levels near $136.56 to $139.24, signaling potential short-term bullish momentum. Conversely, a decline below support at $129 may lead to further downside toward $123.49 to $126.06.
Technical indicators suggest a bearish trend:
- EMA12 is below EMA26, indicating downward momentum.
- SMA50 remains below SMA200, confirming longer-term bearishness.
- RSI is at 26, reflecting oversold conditions.
- Market volatility is very low, supporting the subdued trading environment.
Drivers
The primary factors influencing SOL include:
- 24H return: approximately -0.23%
- EMA slope: negative, reinforcing bearish momentum
- Funding Z-score: near neutral at 0.01
- Basis Z-score: elevated at 1.13, indicating some basis strength
- Order book imbalance (EMA5): slightly negative at -0.09
- BTC 24H return: -0.95%, reflecting broader crypto market weakness
- Market volatility regime remains very low, suggesting lack of directional conviction
Overall, momentum remains cautious with oversold conditions signaling potential for a rebound or further decline depending on support levels.
ETF Flows (BTC/ETH)
Recent ETF flows show a divergence: Bitcoin ETFs experienced a net outflow of approximately $394.7M over a day but accumulated a net inflow of $515M over five days, while Ethereum ETFs saw consistent inflows totaling around $315M over the same period. These flows indicate a cautious risk-on/off sentiment, with a slight preference for ETH among investors. It is important to note that these ETF movements pertain to BTC and ETH and serve as contextual signals rather than direct indicators for SOL.
What to Watch Next
- Monitor if SOL breaches the resistance at $134 for potential upward momentum.
- Watch support levels around $129 for signs of further downside.
- Observe broader Bitcoin and Ethereum ETF flows for shifts in risk appetite.
- Keep an eye on volume and RSI for early signs of trend reversals or continuation.
Disclaimer: ETF flows are only for BTC and ETH and should be considered as part of the broader market context, not as primary signals for SOL.
Hashtags: #Solana #CryptoAnalysis #Bitcoin #Ethereum #MarketUpdate #TechnicalAnalysis #CryptoFlows #RiskOn #RiskOff #Blockchain #Investing #CryptoTrends