Market Snapshot
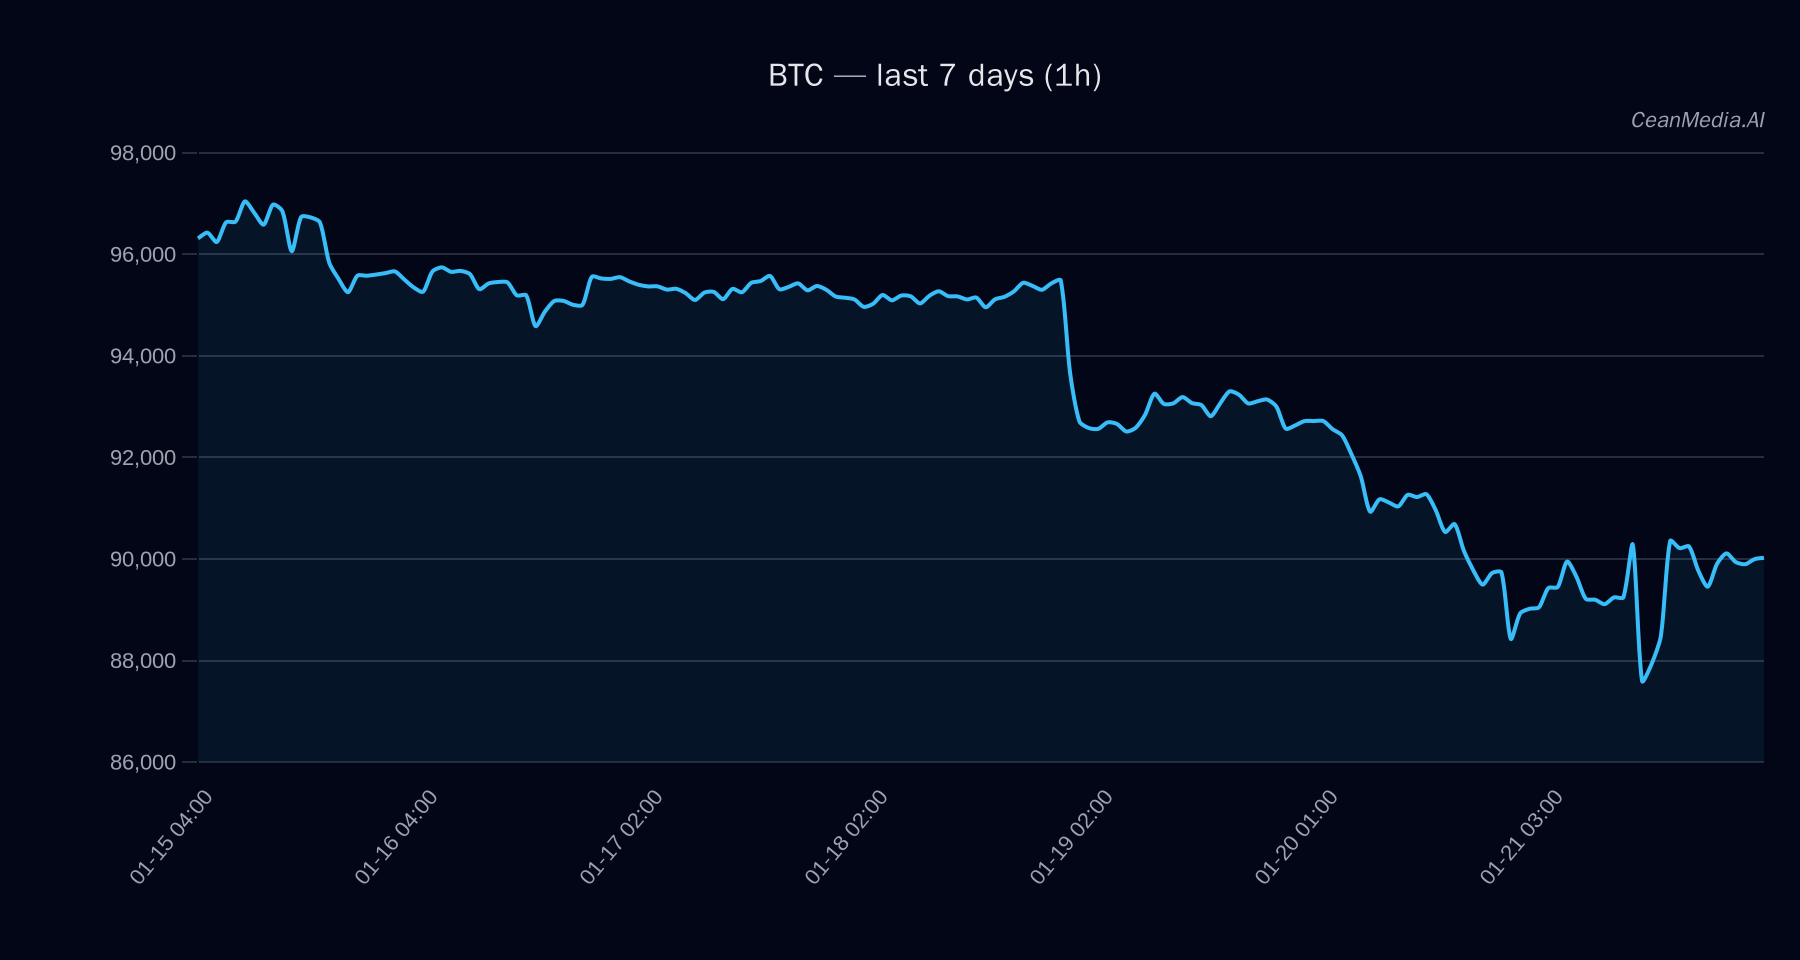
As of January 22, 2026, Bitcoin (BTC) trades around $90,178 with a neutral short-term forecast indicating a slight upward bias at approximately 49%. Market sentiment remains cautious, with very low volatility and an ETF flow environment showing significant outflows from both BTC and ETH ETFs over the past week.
Technical Analysis: BTC
BTC is currently trading between key support at $88,375 and resistance at $91,975. A breakout above the resistance could see prices rise towards $93,821–$95,661, while a break below support may lead to a decline towards $86,607–$84,840. The technical bias is mildly bearish, with EMA12 below EMA26 and SMA50 below SMA200, complemented by a neutral RSI at 53. The probability of upward movement remains slightly under 50%, with a notable support zone near $88,375 and resistance at $91,975.
Drivers
- Return 24H: Minimal gain at 0.08% indicating subdued momentum.
- EMA Slope: Slight positive slope suggests a marginal upward trend.
- Funding Z-Score: Elevated at 0.83, indicating some positive funding pressure.
- Order Book Imbalance: Slight imbalance favors upward movement.
- Volatility Regime: Very low, pointing to consolidation or low activity phase.
- Trend Strength: Weak at 0.02, implying limited directional momentum.
Overall, the drivers suggest a cautious environment with limited short-term momentum, aligning with the neutral technical stance.
ETF Flows (BTC/ETH)
Recent ETF data shows significant outflows: -$352.1M from BTC ETFs over one day, with cumulative outflows reaching -$1.06B over five days and -$1.45B over ten days. ETH ETFs also experienced outflows, but to a lesser extent (-$36.7M daily, -$153.3M over five days, -$427.8M over ten days). These persistent outflows indicate a risk-off sentiment prevailing in the market, although this data should be viewed as contextual rather than primary for BTC’s immediate technical outlook.
What to Watch Next
- Monitor price action around support ($88,375) and resistance ($91,975) levels for potential breakouts.
- Watch for changes in ETF flows, especially if outflows slow or reverse, signaling a potential shift in risk appetite.
- Keep an eye on macroeconomic developments and market sentiment indicators that could influence volatility.
- Observe any divergence between technical signals and market fundamentals for early trend clues.
Note: ETF flow data for BTC and ETH provides context on investor risk appetite but is not a primary trading signal for BTC.
Hashtags: #Bitcoin #CryptoAnalysis #MarketUpdate #BTCForecast #ETFFlows #CryptoNews #TechnicalAnalysis #CryptoTrends #RiskOnOff #MarketSentiment #TradingStrategy #CryptoInvesting