Market Snapshot
As of January 22, 2026, Ethereum (ETH) is trading near key support and resistance levels with a cautious technical outlook. The broader market remains in a low volatility regime, with recent ETF flows indicating a significant outflow from both Bitcoin and Ethereum funds, suggesting a risk-off sentiment among investors.
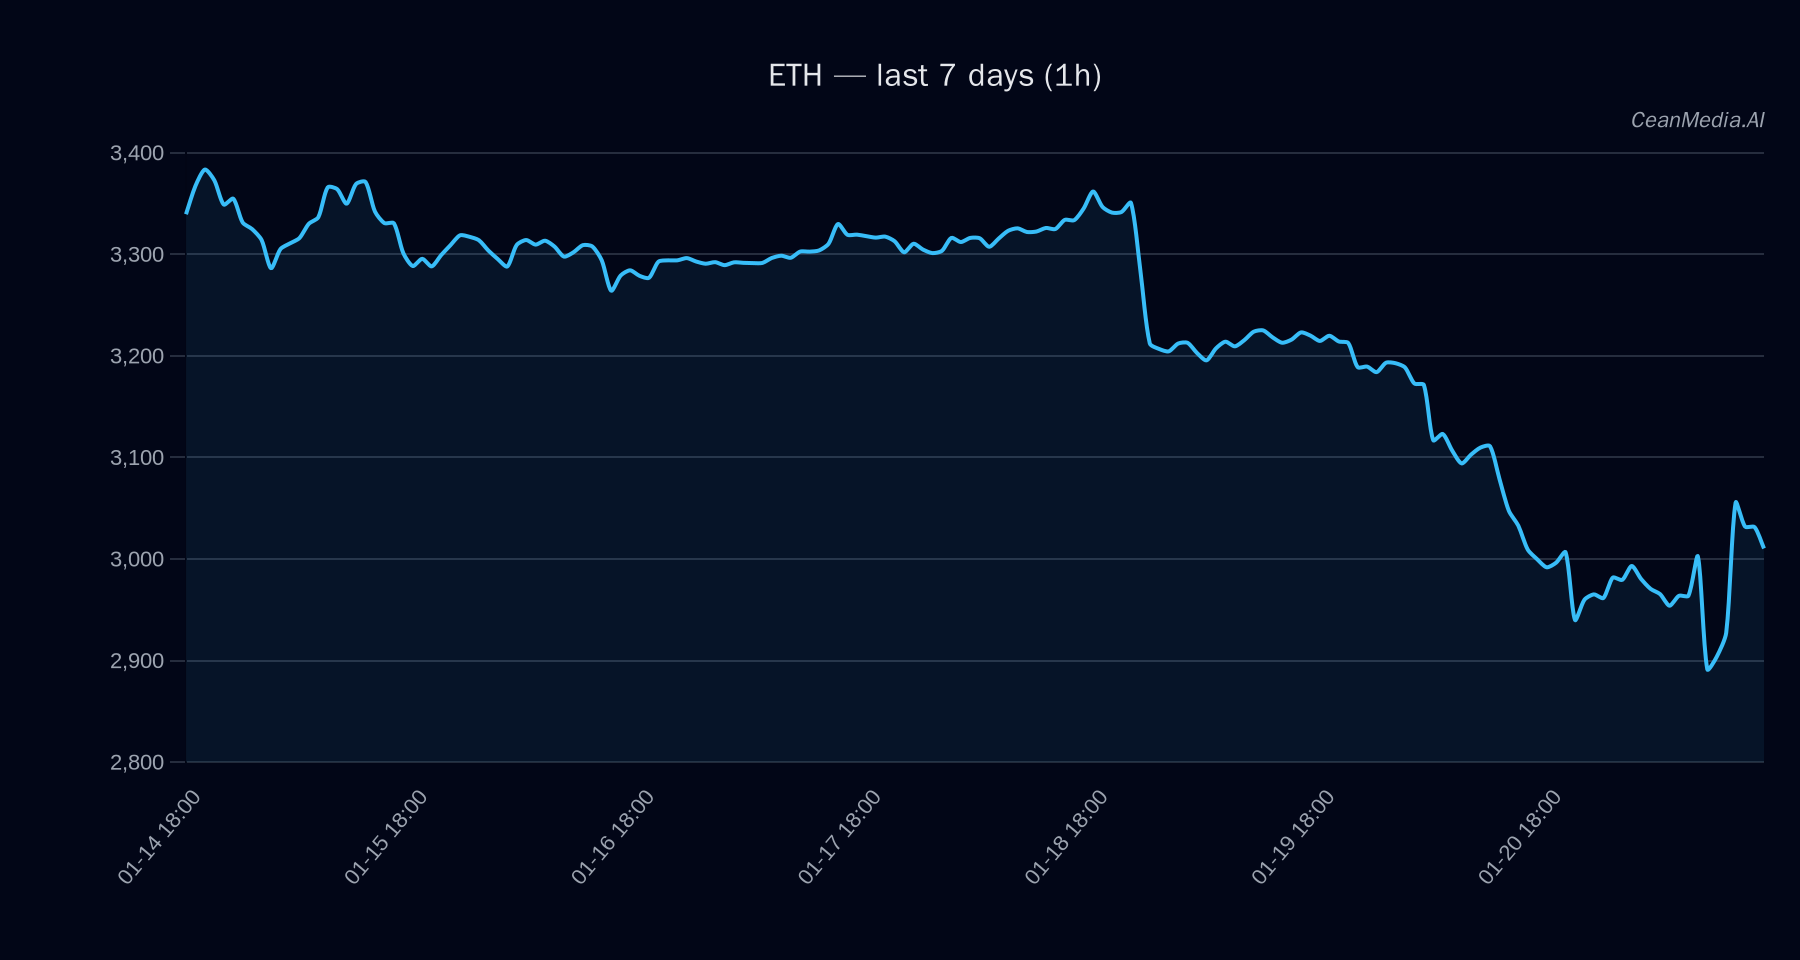
Technical Analysis: ETH
Ethereum is currently positioned between a major support level at approximately 2,936 and resistance at around 3,056. A break above 3,056 could target levels near 3,117 to 3,178, while a breakdown below 2,936 could see prices decline toward 2,818 to 2,878. The technical indicators show a bearish bias, with the EMA12 below EMA26, and the SMA50 under the SMA200. The RSI stands at a neutral 49, indicating a balanced momentum. The short-term forecast suggests a 46% probability of upward movement, but overall, the trend remains cautious with a sideways bias.
Drivers
- EMA Slope: Positive at 0.0012, indicating slight upward momentum.
- Funding Z-Score: Slightly negative at -0.93, reflecting modest bearish funding conditions.
- Basis Z-Score: -1.07, indicating potential downside pressure.
- Order Book Imbalance (EMA5): -0.29, suggesting slight selling pressure.
- Market Volatility Regime: Low, with a volatility of 1, indicating subdued price swings.
- Market Breadth: 33%, showing limited participation across the broader market.
- Correlation with BTC (72h): High at 0.93, implying ETH’s movements are closely tied to Bitcoin’s recent trends.
Overall, momentum remains subdued with low volatility, and market sentiment is cautious.
ETF Flows (BTC/ETH)
Recent ETF data shows significant outflows over the past 10 days, with BTC ETF flows decreasing by approximately $1.34 billion and ETH ETF flows declining by around $278 million. The current outflows highlight a risk-off environment, with investors pulling back from crypto exposure. While these flows do not directly dictate ETH’s short-term price action, they provide important context regarding overall market sentiment and investor appetite for digital assets.
What to Watch Next
- Monitor the breakout levels above 3,056 for potential bullish confirmation.
- Watch for a break below 2,936 to confirm further downside momentum.
- Keep an eye on Bitcoin’s trend, given its high correlation with ETH.
- Observe ETF flow trends for signs of market risk appetite shifting.
In summary, ETH remains in a cautious zone with technical signals leaning bearish, compounded by ongoing ETF outflows indicating risk-off sentiment in the broader crypto market.
Hashtags: #Ethereum #CryptoAnalysis #ETH #MarketUpdate #CryptoTrends #ETFFlows #Blockchain #DigitalAssets #CryptoNews #Investing #MarketSentiment #TechnicalAnalysis