Market Snapshot
As of January 23, 2026, BNB is trading around $889.66, with a short-term forecast indicating a 56% probability of upward movement. The broader market exhibits a cautious tone, with very low volatility and a Fear index reading of 24, suggesting extreme market fear. Bitcoin and Ethereum ETF flows are notably negative over multiple timeframes, reflecting risk-off sentiment in traditional markets.
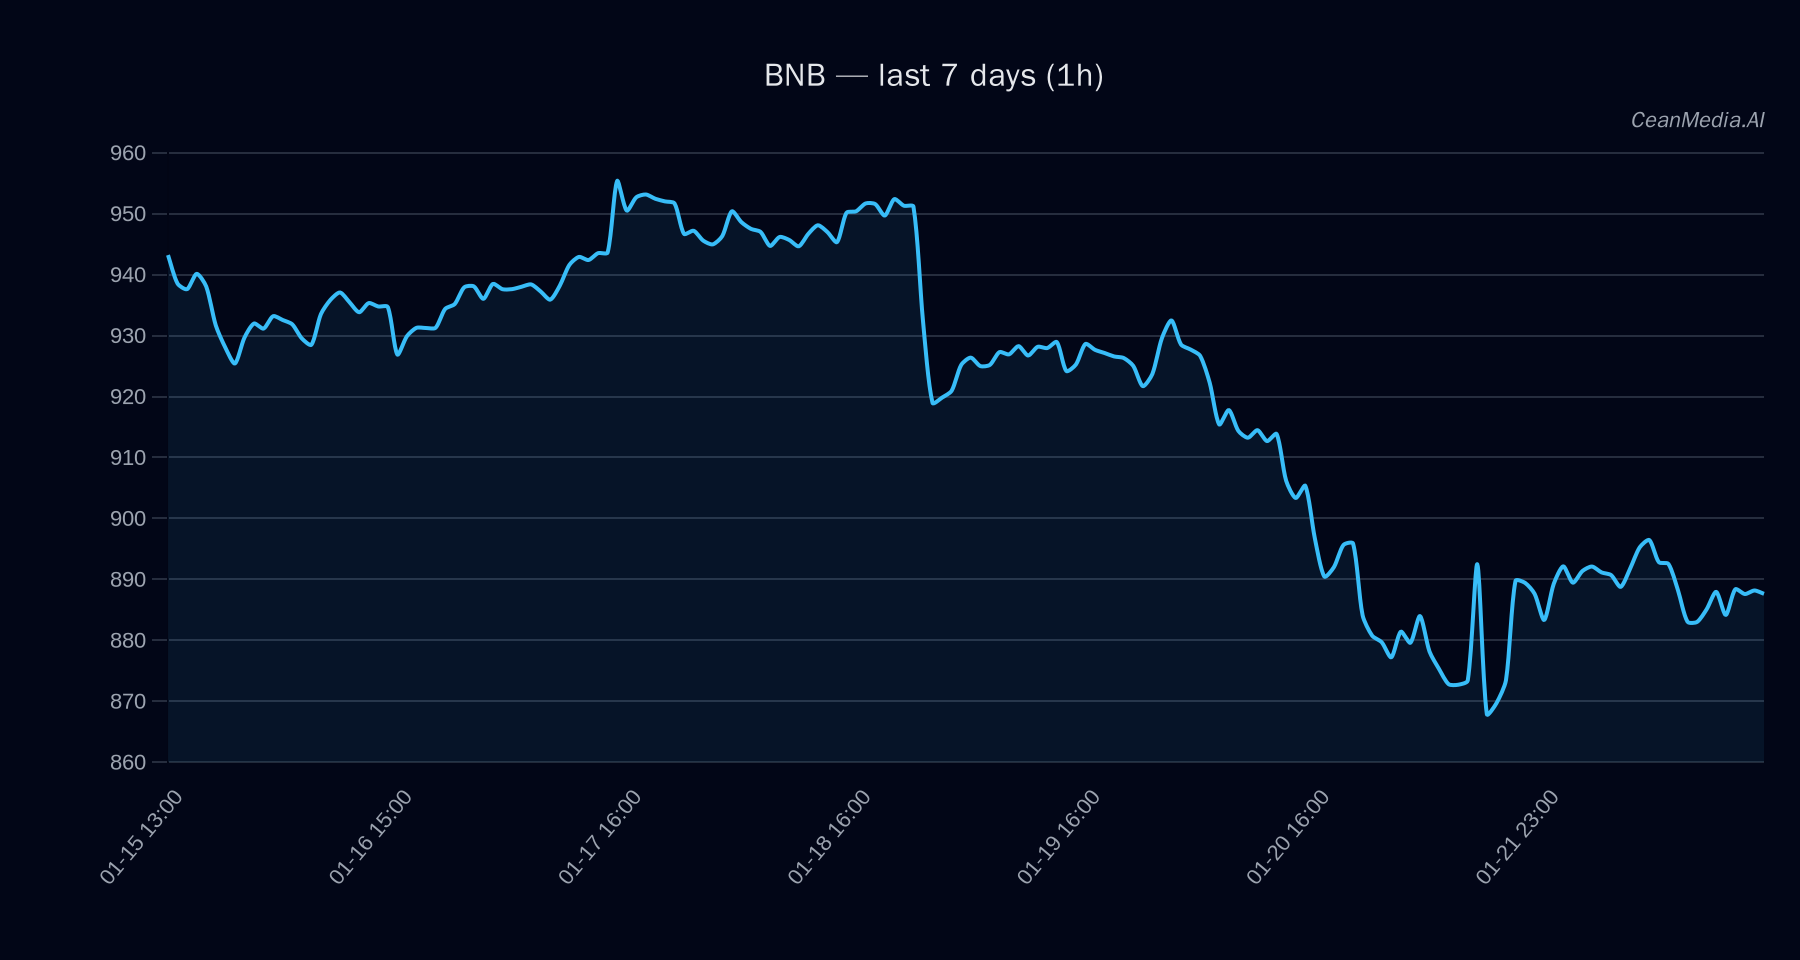
Technical Analysis: BNB
- Key Levels: Support at 872 (major), resistance at 907 (near), with breakout targets at 925.60–943.75 if above resistance, and 854.43–836.99 if below support.
- Bias: Bearish signals dominate, with EMA12 below EMA26 and SMA50 below SMA200, indicating downward momentum. RSI remains neutral at 52, supporting a sideways to slightly downward bias.
- Invalidation & Triggers: A close above 907 would trigger a bullish move toward 925.60–943.75; a close below 872 would confirm further downside toward 854.43–836.99.
- Forecast: Slight upward bias with a 56% confidence, yet technicals remain cautious due to bearish EMA and SMA signals.
Drivers
- Top Factors: Flat 24-hour return (0%), funding Z-score at -0.28, and basis Z-score near zero suggest limited immediate momentum.
- Market Momentum & Volatility: Order-book imbalance is slightly positive, but overall, the very low volatility regime and BTC trend strength of 0.32 indicate subdued market activity and cautious sentiment.
- Additional Indicators: BTC’s 24h return of -0.47% and a slight decrease in dominance (57.5%) reflect ongoing risk-off conditions affecting broader crypto markets.
ETF Flows (BTC/ETH)
Recent ETF data shows significant outflows: Bitcoin ETFs have seen a combined decline of over $1.45 billion in the past 10 days, while Ethereum ETFs have also experienced outflows totaling approximately $427.8 million over the same period. These persistent outflows indicate a broad risk-off environment, with investors reducing exposure to major cryptocurrencies. It is important to note that these flows pertain only to BTC and ETH and serve as contextual signals rather than direct indicators for BNB.
What to Watch Next
- Monitor BNB’s price action around the 872 support and 907 resistance levels for potential breakout confirmation.
- Watch for a close above 907 to validate a bullish move towards 925.60–943.75.
- Observe broader market sentiment, especially ETF flows in BTC and ETH, for signs of risk appetite returning.
- Keep an eye on the overall volatility regime, which remains very low, potentially limiting sharp price movements.
Hashtags: #Crypto #BNB #TechnicalAnalysis #MarketUpdate #ETFFlows #Bitcoin #Ethereum #Altcoins #RiskOff #MarketSentiment #TradingStrategies #CryptoNews