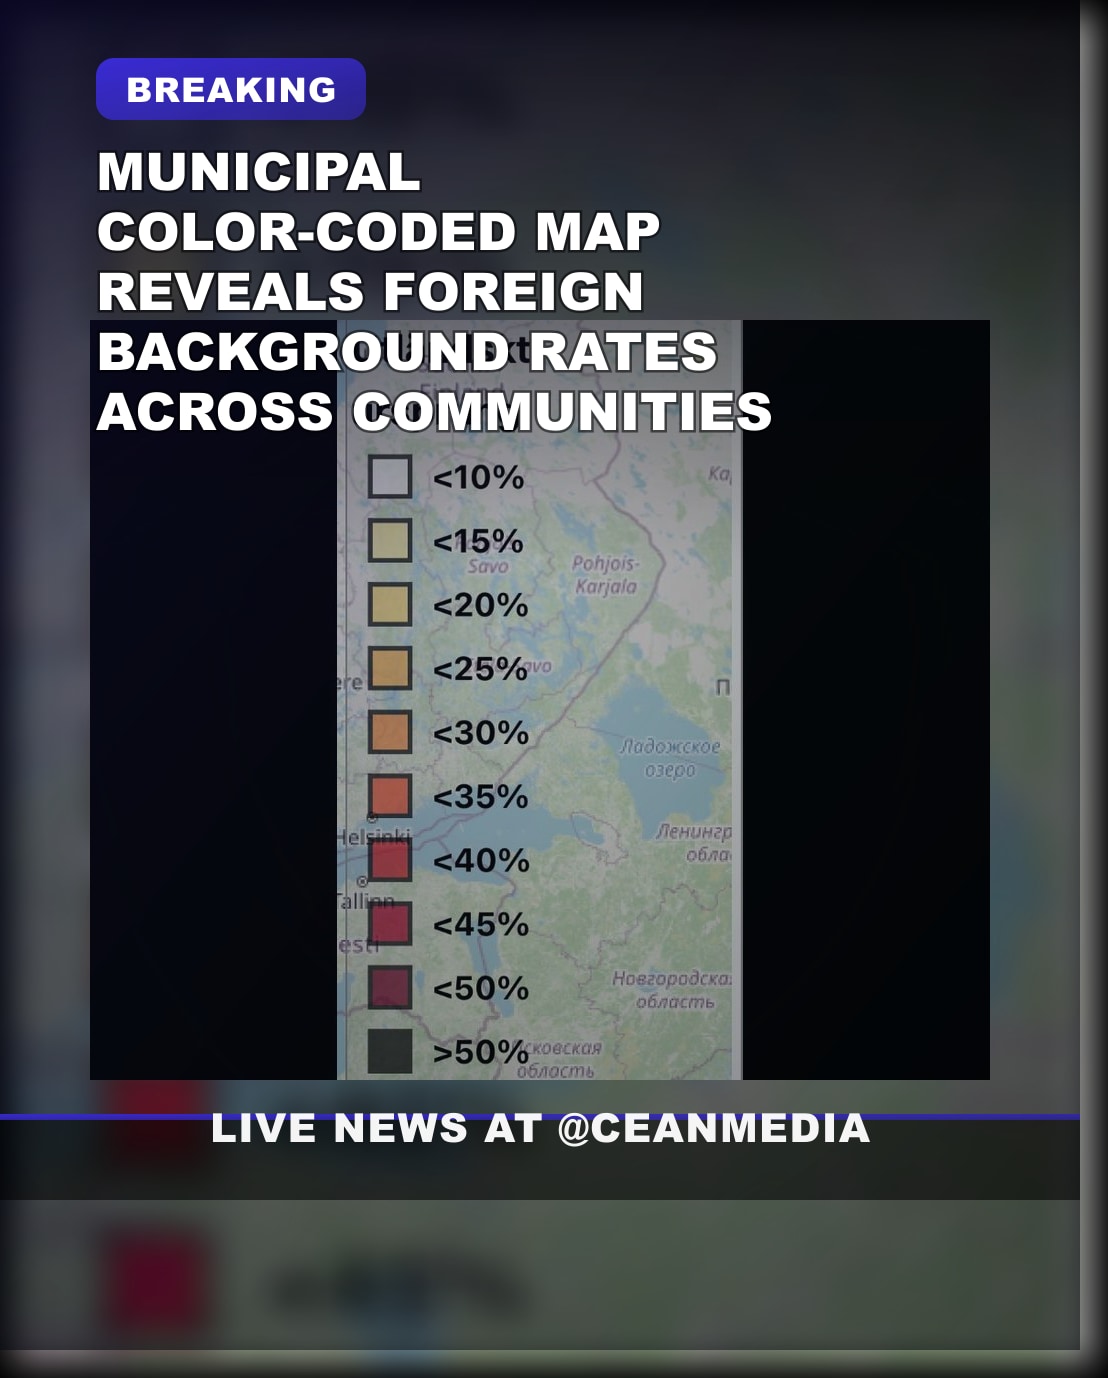
A new map has been released illustrating the distribution of residents with foreign backgrounds across various municipalities. The map employs a color-coding system to visually represent the proportion of residents with a migration background in each area, providing a clear overview of demographic diversity at the local level.
This visual tool aims to enhance understanding of migration patterns and demographic compositions within the country. It can be a useful resource for policymakers, researchers, and the general public interested in regional diversity and integration efforts. The map is accessible through the website migrationskartan.se, where users can explore detailed data for different municipalities.
The presentation of this information aligns with ongoing efforts to increase transparency and facilitate informed discussions about migration and demographic changes. It highlights varying levels of foreign-background populations across regions, helping to identify areas with higher or lower proportions of residents with migration histories. Users are encouraged to visit the source for more comprehensive insights and data interpretations.