Market Snapshot
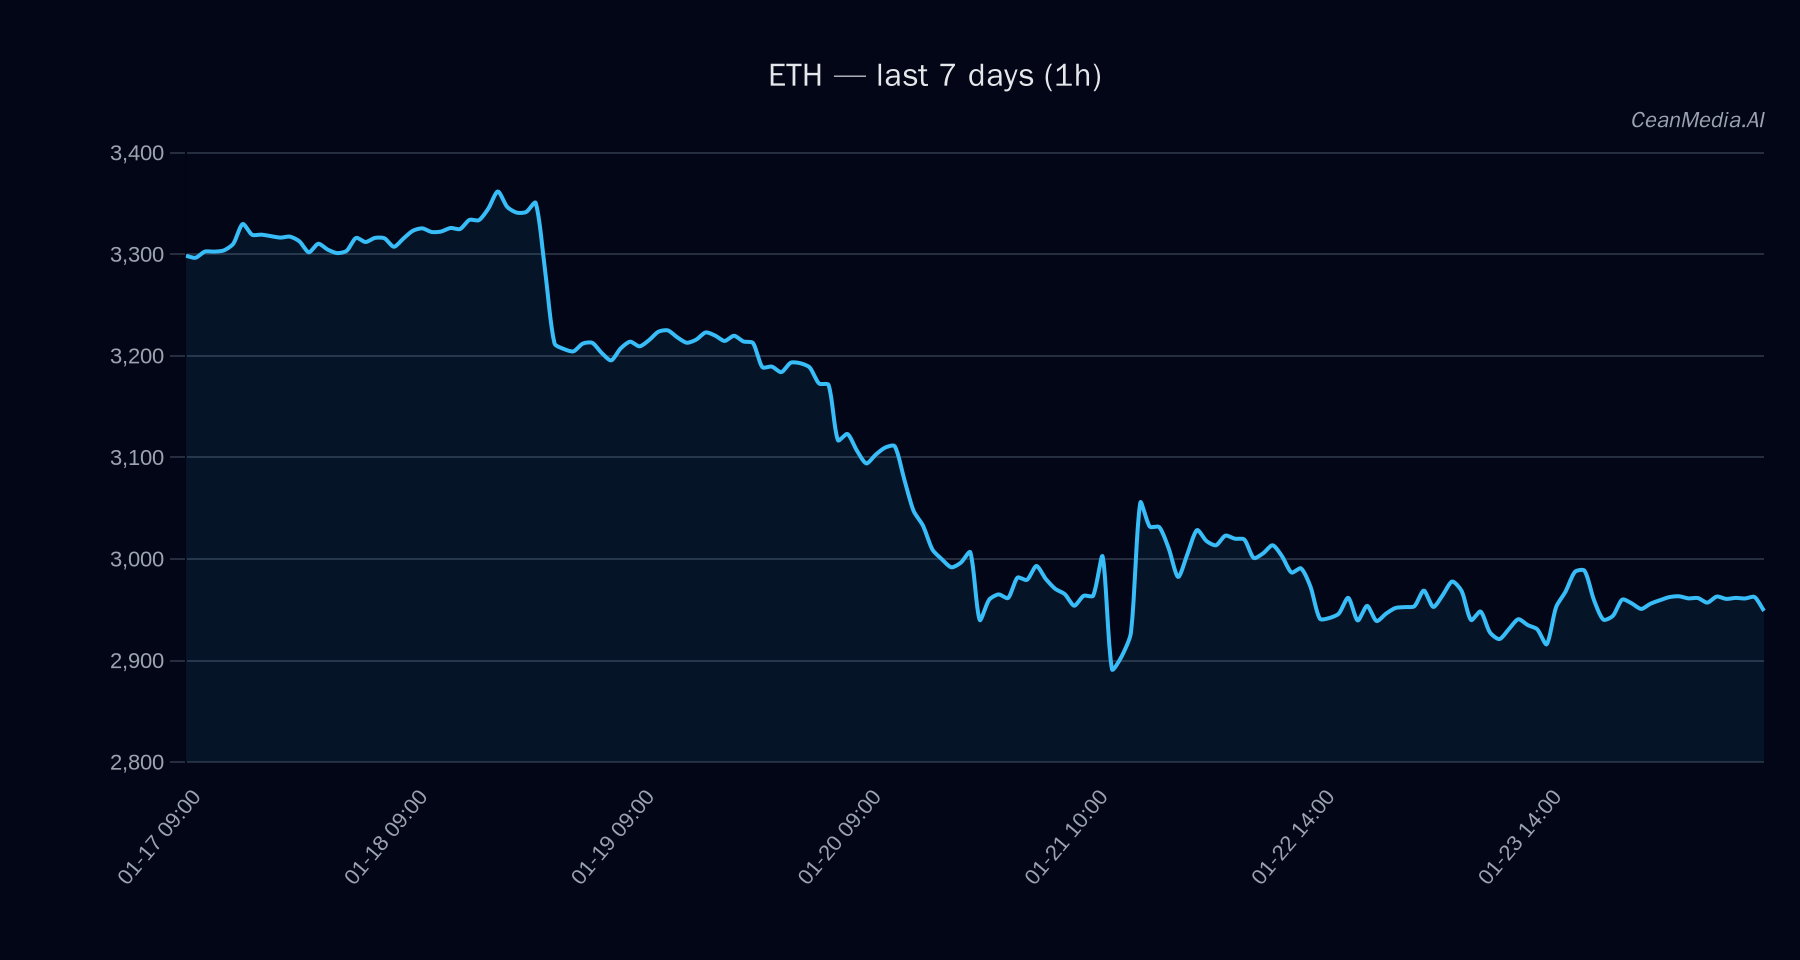
As of January 24, 2026, Ethereum (ETH) is trading around $2,958.35, situated between key support at $2,900 and resistance at $3,018. The short-term forecast indicates a 63% probability of upward movement, with the price currently displaying sideways momentum within established levels. Market sentiment remains cautious, with very low volatility and neutral RSI, suggesting a consolidative phase ahead.
Technical Analysis: ETH
ETH’s current price hovers between the major support at $2,962 and resistance at $3,018. A breakout above $3,018 could propel the price toward $3,077.87 to $3,138.22, signaling a bullish move. Conversely, a decline below $2,900 may lead to a drop toward $2,841.20 to $2,783.22, indicating potential downside risk.
Key technical indicators include:
- EMA12 above EMA26, indicating a short-term bullish trend.
- SMA50 below SMA200, suggesting a longer-term sideways or consolidative bias.
- RSI at neutral 50, supporting a non-extreme momentum stance.
- Very low volatility regime (σ24h 0.43%) points to a lack of strong directional drive.
The overall bias remains sideways with a slight tilt towards upward movement if resistance levels are broken convincingly. Invalidations occur if ETH closes below $2,900, confirming potential further downside.
Drivers
The top factors influencing ETH include:
- 24H return at 0.62%, indicating minimal recent price change.
- EMA slope slightly negative at -0.0006, reflecting marginal short-term weakening.
- Funding Z-score at -1.32 and Basis Z-score at -1.25 suggest slight bearish funding conditions but not extreme.
- Order-book imbalance (EMA5) at 0.36 supports a neutral to mildly bullish sentiment.
- BTC’s minimal 24H return of 0.02% and trend strength of 0.0123 show limited crypto-wide momentum.
Market breadth remains below 50%, and volatility measures are subdued, indicating a cautious environment.
ETF Flows (BTC/ETH)
Recent ETF flow data highlights contrasting investor sentiments:
- Bitcoin ETFs experienced outflows, with 1D at -$1.9M, 5D at -$1.24B, and 10D at -$578.5M, suggesting risk-off sentiment towards Bitcoin.
- Ethereum ETFs showed inflows, with 1D at +$2.8M, although the 5D and 10D flows remain negative (-$256.8M and -$165.1M respectively), indicating mixed investor interest.
While ETF flows provide context, they are not primary signals for ETH’s immediate price direction but reflect broader risk appetite trends affecting the crypto market.
What to Watch Next
- Break above resistance at $3,018 to confirm potential upward momentum towards $3,077–$3,138.
- Close below support at $2,900 to assess downside risk towards $2,783–$2,841.
- Monitor ETF flow shifts, especially in ETH, for clues on institutional investor sentiment.
- Observe changes in volatility and momentum indicators for signs of a breakout or further consolidation.
Hashtags: #Ethereum #CryptoAnalysis #ETH #MarketUpdate #TechnicalAnalysis #CryptoTrends #Blockchain #Investing #DeFi #Altcoins #CryptoNews #Trading