Market Snapshot
As of January 27, 2026, Bitcoin (BTC) is trading around $88,462, with a short-term bias leaning slightly upward at a probability of 48%. The broader market context remains cautious, with very low volatility and a neutral RSI of 55. The market breadth is strong at 100%, and Bitcoin’s dominance stands at 57.4%, indicating sustained institutional interest despite recent ETF outflows.
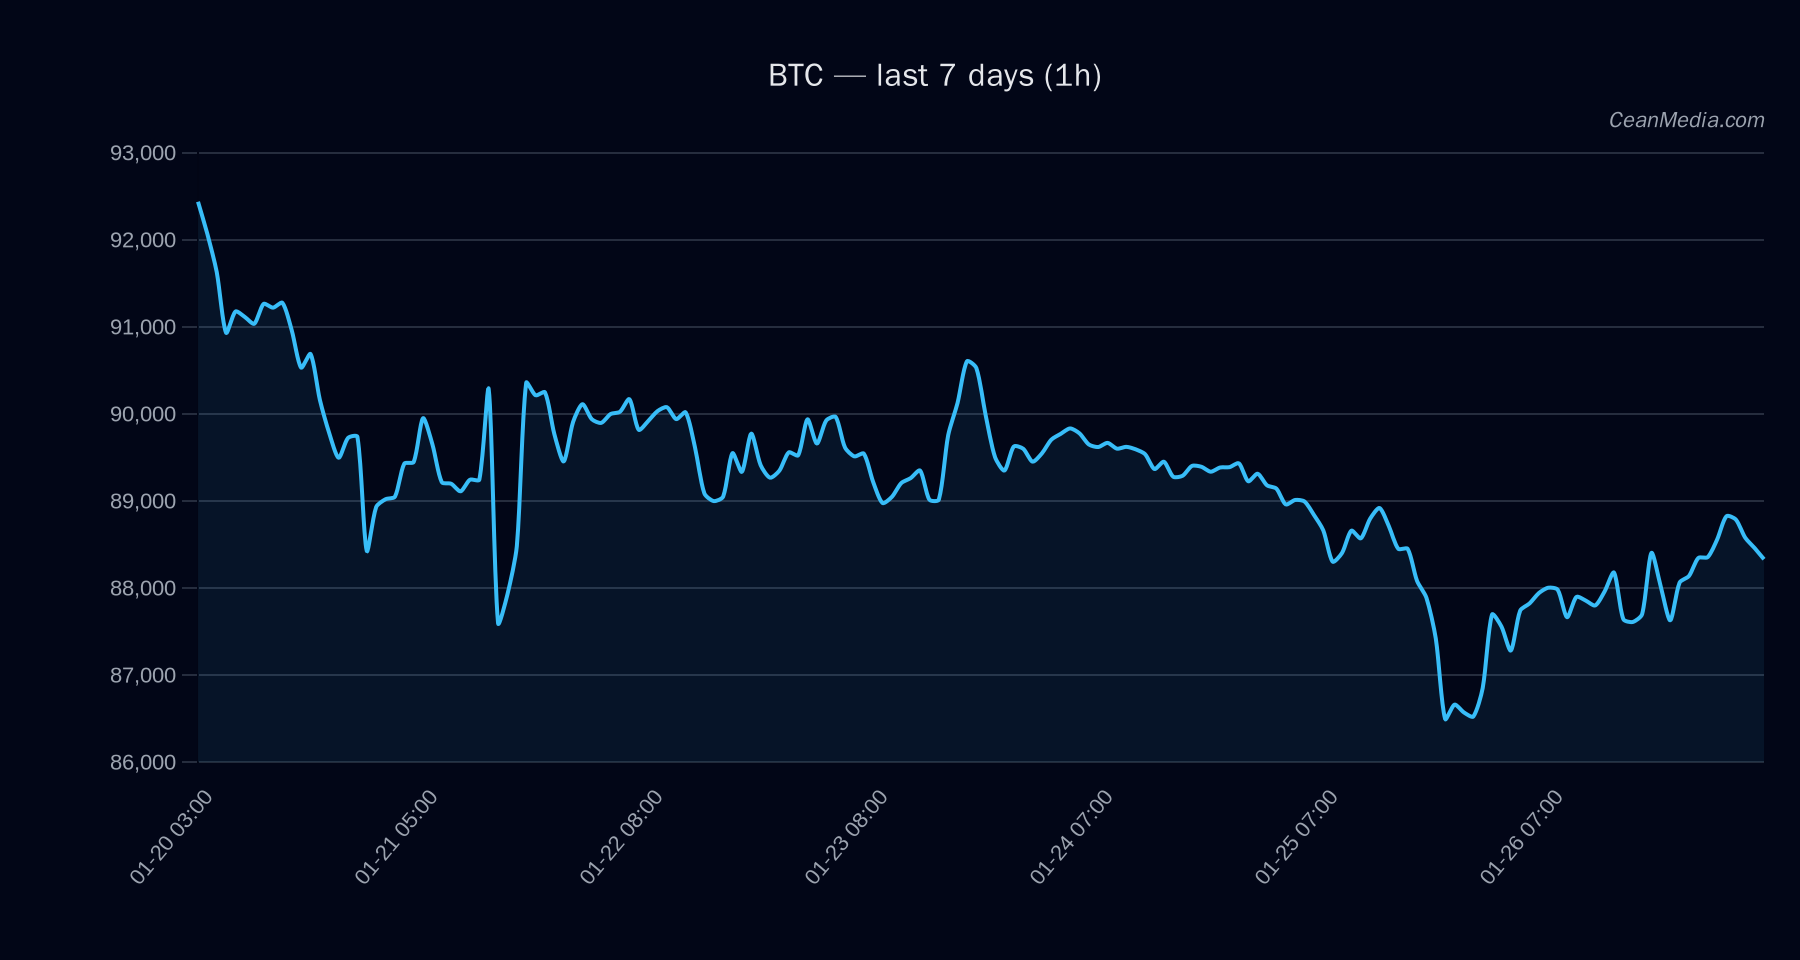
Technical Analysis: BTC
Bitcoin is currently trading between major support at $86,700 and resistance at $90,225. A break above $90,225 could propel the price towards $92,036 to $93,840, while a decline below support could see prices fall to $84,959 or lower to $83,225. The technical indicators suggest a sideways trend, with EMA12 above EMA26, SMA50 below SMA200, and RSI holding at a neutral 55. The market’s low volatility regime supports a cautious outlook, with no imminent breakout signals.
Drivers
- Return 24H: +0.72%
- EMA Slope: Slight upward momentum at 0.0002
- Funding Z-Score: 0.22, indicating minimal funding pressure
- Basis Z-Score: 0.77, reflecting stable basis
- Order Book Imbalance (EMA5): 0.0054, suggesting balanced order flow
- Trend Strength: Moderate at 0.47
- Market Breadth: 100%, indicating broad participation
The market shows a cautious but stable momentum, with no significant volatility signals or trend shifts currently evident.
ETF Flows (BTC/ETH)
Recent ETF flow data reveals continued outflows from Bitcoin ETFs, with a 1-day decline of approximately $9.1 million and a 5-day total outflow of nearly $954.2 million. Conversely, Ethereum ETFs experienced inflows, with a 1-day increase of $137.2 million and a 5-day net outflow of only $168.8 million. These flows suggest a nuanced risk environment, where ETF activity indicates some risk-off sentiment towards Bitcoin, while ETH shows signs of relative strength. It’s important to note that ETF flows are only available for BTC and ETH and serve as contextual indicators rather than primary signals for Bitcoin’s immediate direction.
What to Watch Next
- Monitor the breakout above $90,225 for potential bullish acceleration toward $92,036–$93,840.
- Watch for a decline below $86,700, which could trigger further downside to $84,959 and below.
- Keep an eye on ETF flows, especially the continued outflows from BTC and inflows into ETH, for insight into risk sentiment.
- Observe upcoming volume and volatility shifts for signs of increased market activity or trend change.
Hashtags: #Bitcoin #CryptoAnalysis #BTC #MarketUpdate #ETFFlows #CryptoTrends #TechnicalAnalysis #CryptoNews #Blockchain #Investing #FinancialMarkets #CryptoInsights