Market Snapshot
On January 28, 2026, BNB is trading around $897.11 with a neutral short-term bias. The broader market shows minimal volatility, with a very low 24-hour trading regime and a slight positive return of 0.03%. ETF flows for Bitcoin and Ethereum indicate divergent trends, providing additional context for market sentiment.
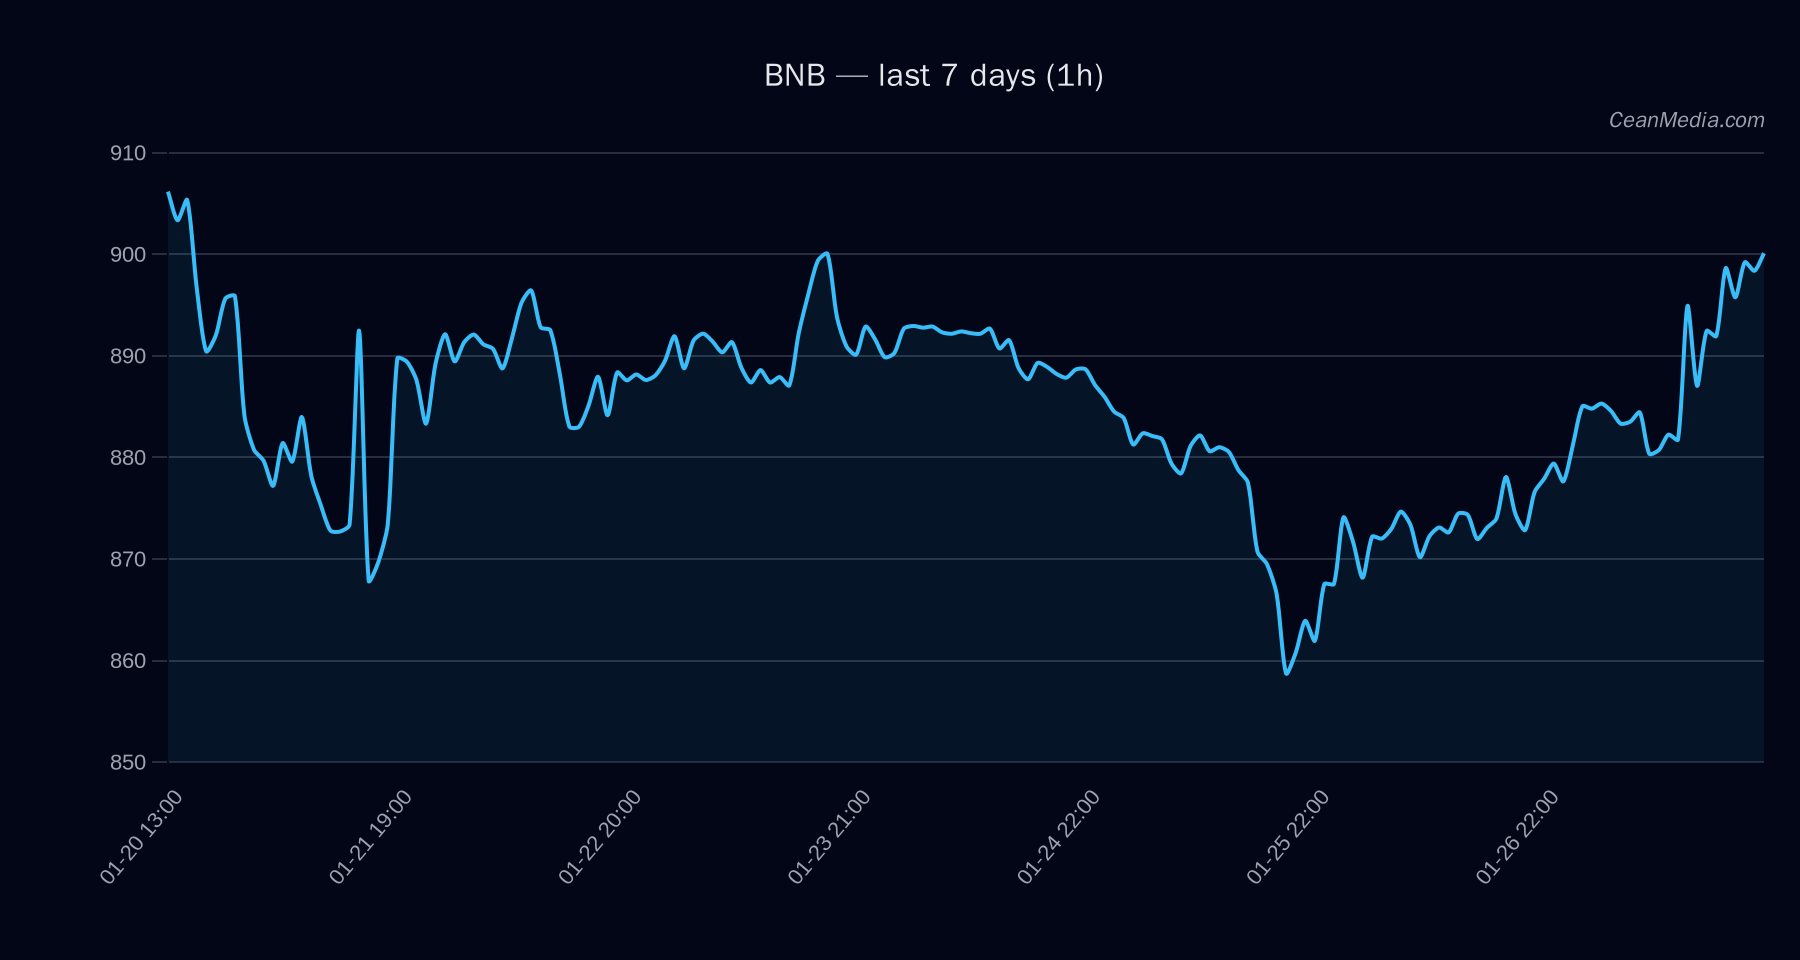
Technical Analysis: BNB
BNB currently sits between key support at approximately $878 and resistance near $915. The technical indicators suggest a sideways movement with a slight upward bias, as evidenced by the EMA12 being above EMA26, while the SMA50 remains below SMA200. The RSI stands at 63, indicating a neutral momentum. Breakouts above $915 could propel prices toward $933–$951, whereas a decline below $879 might see a move toward $861–$844. The current probabilistic forecast favors a modest upward move, with a 50% chance of price increase within the next 24 hours. Invalidation occurs if price drops below support levels, emphasizing the importance of watchful levels for traders.
Drivers
- Return 24H: +0.03%
- EMA Slope: +0.0014, indicating slight positive momentum
- Funding Z-Score: 1.78, suggesting moderate funding pressure
- Basis Z-Score: 1.75, reflecting slight bullishness
- Order Book Imbalance (EMA5): -0.17, showing slight selling pressure
- BTC Return 24H: +0.01%, correlating modestly with BNB movement
- BTC Trend Strength: 0.56, indicating a mild trend
- Market Breadth: >50h at 100%, signaling broad participation
- Volatility Regime: Very low, implying subdued trading activity
ETF Flows (BTC/ETH)
Recent ETF data shows inflows into Bitcoin ETFs (+$6.8M daily), but over the past five days, there has been significant outflow (-$938.3M). Ethereum ETFs have experienced a positive inflow of $119.5M today, with modest net flows over five and ten days. These flows suggest a cautious risk-on environment for Ethereum, while Bitcoin shows signs of profit-taking after recent gains. It is important to note that ETF flows for BTC and ETH are only contextual and should not be solely relied upon for BNB trading decisions.
What to Watch Next
- Monitor price action around support at $878 and resistance at $915 for potential breakout signals.
- Observe the momentum indicators, especially RSI and EMA slopes, for signs of trend acceleration or reversal.
- Keep an eye on Bitcoin and Ethereum ETF flows as an indicator of overall risk sentiment.
- Watch for volume spikes and volatility shifts that could precede significant moves.
Hashtags: #BNB #CryptoAnalysis #MarketUpdate #TechnicalAnalysis #ETFFlows #Bitcoin #Ethereum #Altcoins #CryptoTrading #MarketSentiment #Blockchain