Market Snapshot
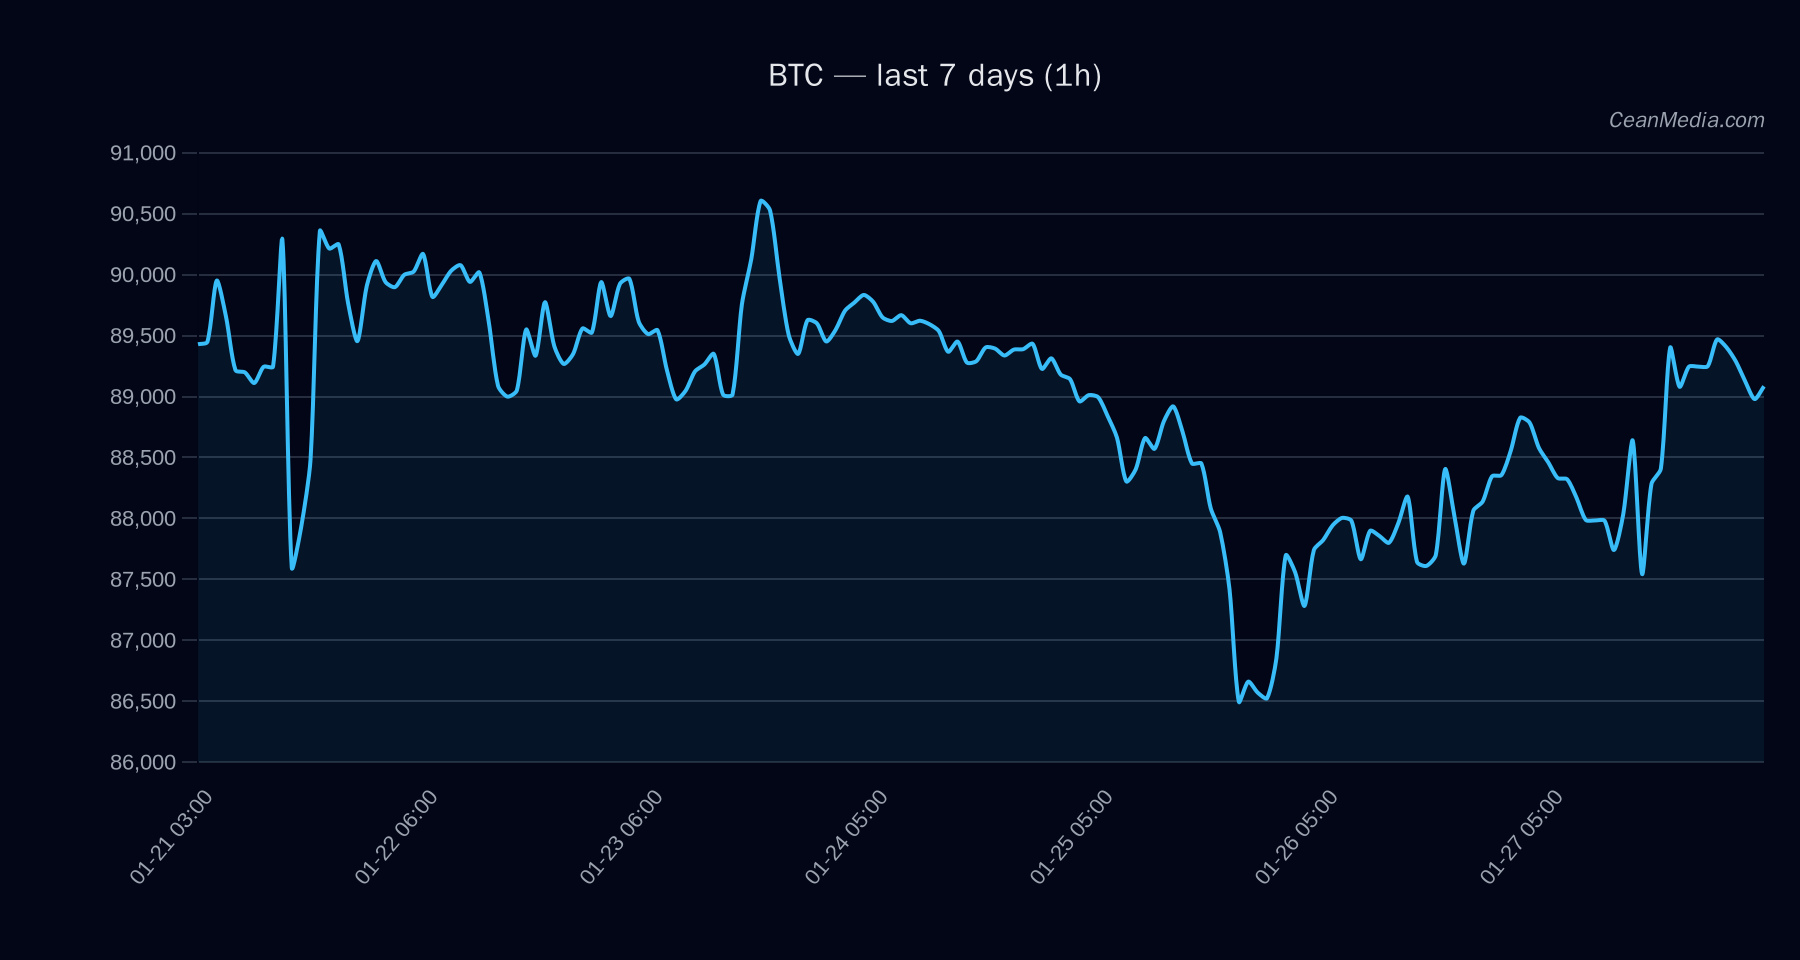
As of January 28, 2026, Bitcoin (BTC) trades near the key support level of 87,450 USD, with a current price around 89,222 USD. The broader market sentiment remains cautious, with very low volatility and a neutral RSI of 58. ETF flows indicate ongoing institutional adjustments, especially in Bitcoin and Ethereum products, reflecting a nuanced risk environment.
Technical Analysis: BTC
- Levels to Watch: Support at 87,450 USD; Resistance at 91,000 USD. Break above 91,000 USD targets 92,827 to 94,648 USD, while a decline below support could see prices fall to 85,690 USD or lower.
- Bias and Indicators: The technical bias is sideways with a slight upward tilt, supported by EMA12 > EMA26 and SMA50 < SMA200. RSI stands at 58, indicating neutral momentum. The current volatility regime is very low, suggesting consolidation.
- Triggers: A close above 91,000 USD could accelerate gains towards 94,648 USD. Conversely, a close below 87,450 USD may trigger further declines toward 83,941 USD.
- Invalidation: A sustained close below 87,450 USD invalidates the short-term bullish outlook, increasing downside risk.
Drivers
- Top Factors: The 24-hour return remains minimal at 0.0071, with EMA slope showing slight upward momentum. Funding and basis z-scores are modest, indicating limited leverage or funding pressures.
- Momentum and Volatility: Trend strength is moderate at 0.31, with low volatility regimes across BTC and broader markets. The order-book imbalance remains neutral, supporting a sideways trading environment.
- Market Sentiment: Breadth metrics are positive at 100%, but overall fear remains at a level of 29, suggesting cautious positioning among traders.
ETF Flows (BTC/ETH)
Current ETF data shows outflows in Bitcoin-related ETFs with a 1-day decline of 44.6 million USD and a 5-day total outflow of 503.2 million USD. Ethereum ETFs also experienced minor outflows over the same period. These flows are indicative of risk-off sentiment but should be interpreted as contextual rather than primary signals for Bitcoin’s immediate price direction.
What to Watch Next
- Monitor the 91,000 USD resistance level for potential breakout confirmation.
- Watch for a sustained move below 87,450 USD as an invalidation signal for the current bias.
- Keep an eye on ETF flow trends, especially in Bitcoin and Ethereum, for signs of institutional risk appetite shifts.
- Observe broader market sentiment and volatility regimes for clues on potential trend acceleration or consolidation.
Hashtags: #Bitcoin #CryptoAnalysis #BTC #MarketUpdate #ETFFlows #CryptoTrends #TechnicalAnalysis #CryptoNews #Investing #Blockchain #FinancialMarkets #Crypto