Market Snapshot
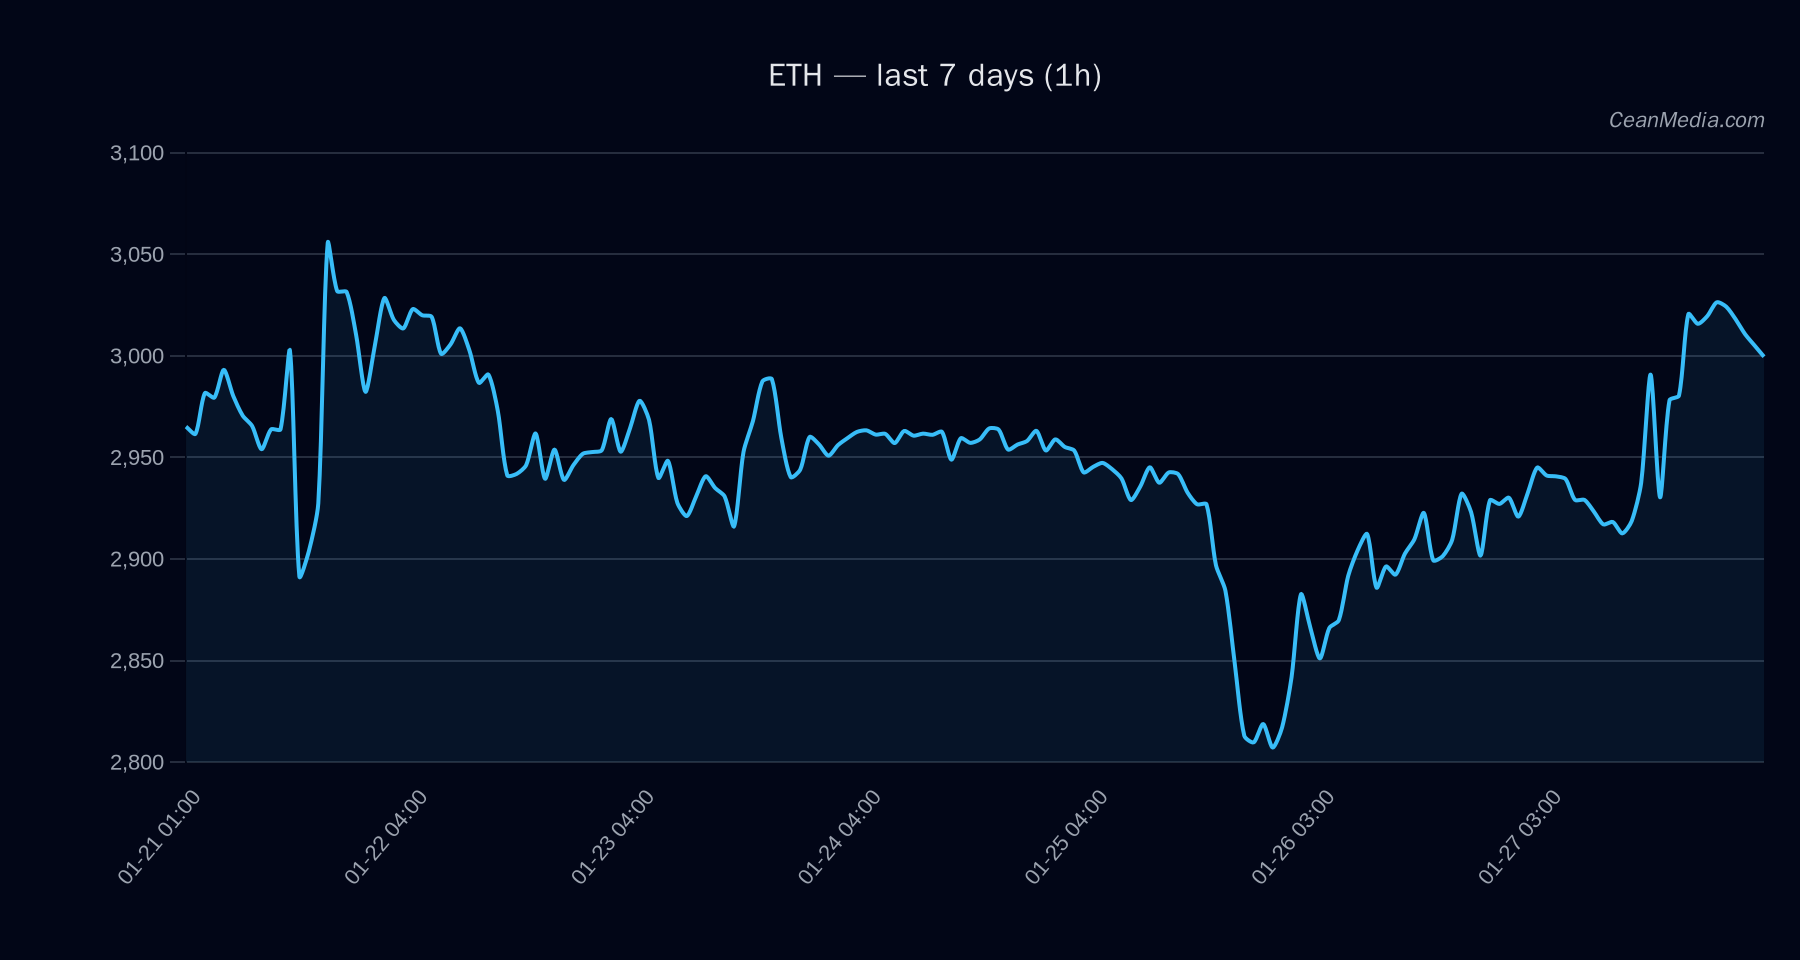
As of January 28, 2026, Ethereum (ETH) trades around $3,012, with a slight positive bias indicated by recent technical signals. The market exhibits low volatility, with very low trading regimes and a broad sideways movement in the short term. ETH’s market breadth remains robust, and broader crypto sentiment shows cautious optimism despite some risk-off signals in ETF flows.
Technical Analysis: ETH
- Levels: Current price is near the key support at $2,952 and resistance at $3,072. A break above resistance targets $3,134 to $3,196, while a break below support could see ETH decline to approximately $2,834.
- Bias: Slightly bullish with a 51% probability of upward movement in the short term, though technical indicators suggest sideways trading.
- Triggers: A close above $3,072 would reinforce bullish momentum, while a close below $2,952 could signal further downside.
- Invalidation: Break below $2,952 invalidates near-term bullish outlook, targeting lower support zones.
Drivers
- Top factors influencing ETH include a modest 24-hour return of 0.02%, stable funding z-score (~1.25), and order book imbalance (EMA5) at 0.39, indicating limited directional pressure.
- Market momentum remains subdued, with EMA slope near zero and trend strength around 0.54, supporting sideways movement.
- Bitcoin’s 24-hour return at approximately 0.0045% and a stable trend strength suggest limited contagion impact, with the broader crypto environment remaining cautious yet stable.
ETF Flows (BTC/ETH)
Recent ETF flow data indicates a risk-off sentiment in traditional markets, with BTC ETFs experiencing outflows of approximately $44.6 million daily over the past 1 day and larger outflows over 5 and 10 days. Conversely, ETH ETFs have seen a smaller daily outflow of $2.7 million but a positive flow over 5 days (+$40.8 million), suggesting some investor interest returning to ETH in the longer term. These flows signal cautious risk appetite, with crypto assets under slight pressure, though ETH shows relative resilience compared to Bitcoin.
It is important to note that ETF flows are only available for BTC and ETH and serve as a contextual indicator rather than a primary trading signal for ETH.
What to Watch Next
- Monitor ETH price movement relative to key support at $2,952 and resistance at $3,072.
- Watch for a decisive close above $3,072 to confirm potential upward breakout.
- Observe broader ETF flow trends for clues on risk sentiment in traditional markets.
- Stay alert for changes in technical momentum indicators and volatility regimes.
Hashtags: #Ethereum #CryptoAnalysis #MarketUpdate #ETFs #Bitcoin #Altcoins #TradingSignals #TechnicalAnalysis #CryptoFlows #RiskOn #RiskOff #CryptoNews