Market Snapshot
As of January 29, 2026, XRP trades around $1.89, with a short-term bearish bias indicated by technical signals. The broader crypto market exhibits low volatility, with ETF flows showing sustained outflows from Bitcoin and modest flows for Ethereum. These macro trends suggest cautious risk sentiment among investors.
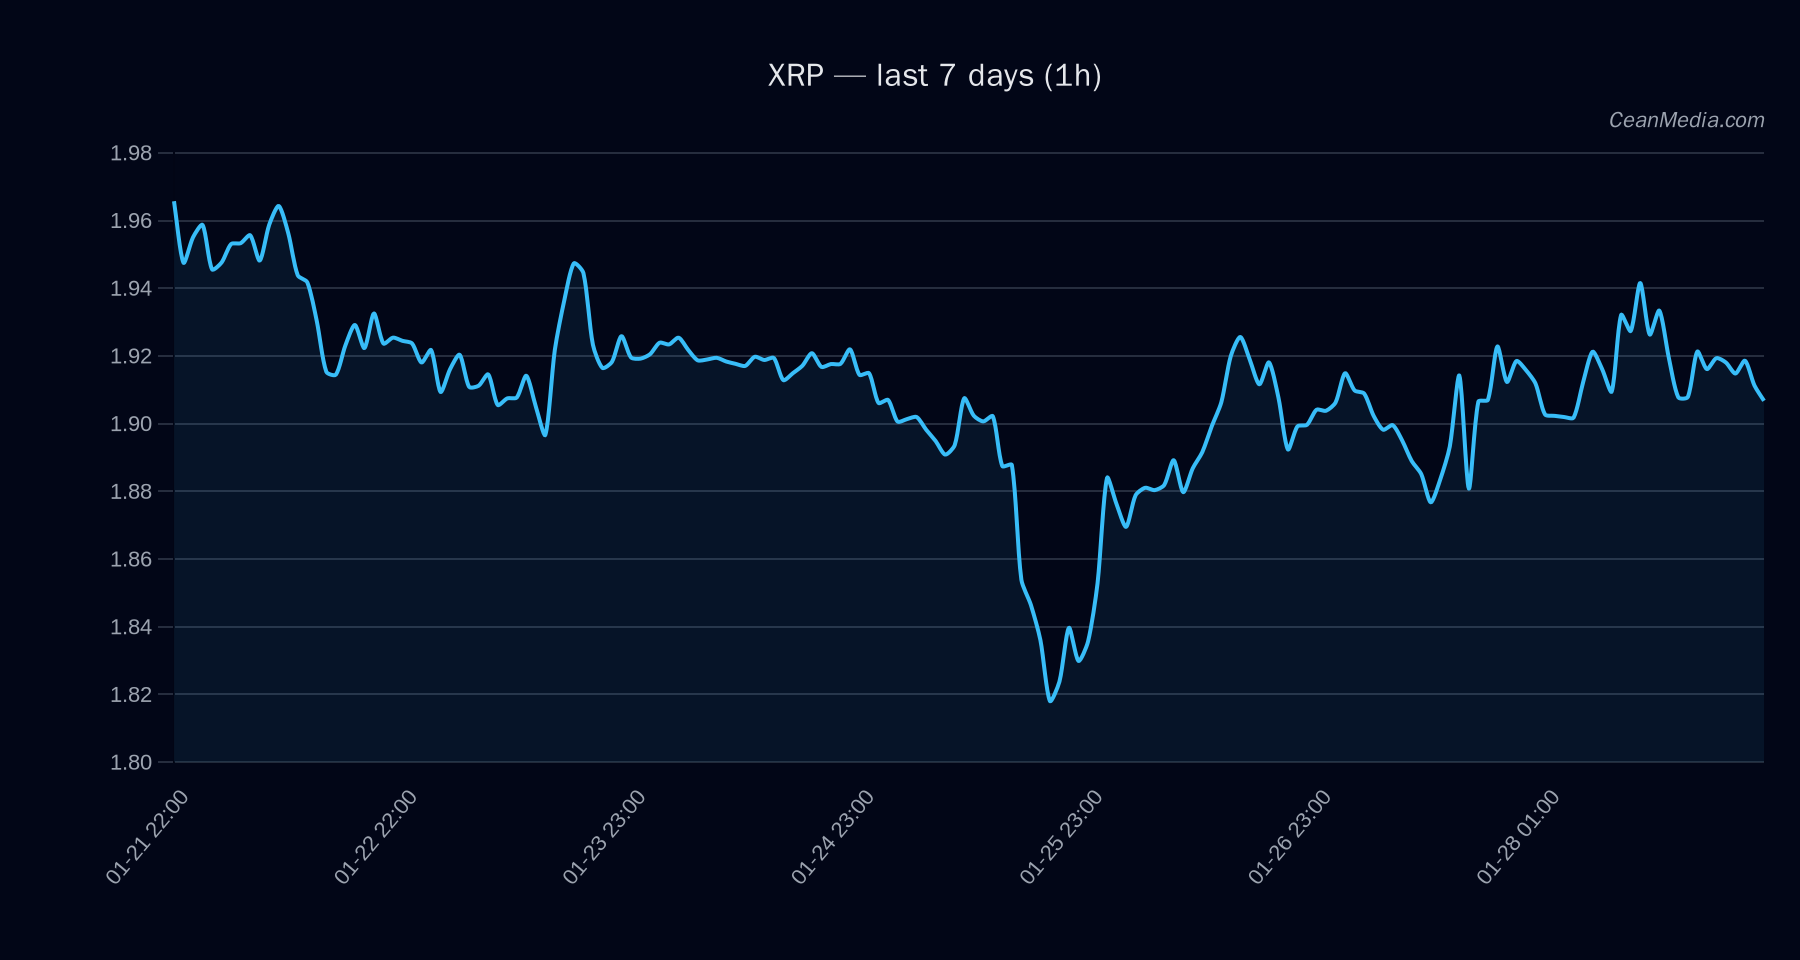
Technical Analysis: XRP
- Key Levels: Support at approximately $1.86 (major support), resistance near $1.94 (major resistance). A breach above $1.94 could target $1.97–2.01, while a drop below $1.86 may see prices fall to $1.78–1.82.
- Bias: Bearish in the short term, supported by EMA12
- Triggers: A daily close above $1.94 could signal a short-term bullish move towards $1.97–2.01; a close below $1.86 would reinforce the downside bias.
- Invalidation: Break below $1.86 invalidates the support, increasing downside risk.
Drivers
- Top factors influencing XRP include a slight negative return over the past 24 hours (-0.0027), a marginally declining EMA slope, and a funding Z-score of 0.78 indicating neutral funding conditions.
- Market momentum remains subdued, with low volatility regimes and a 24-hour Bitcoin return of -0.0036, reflecting cautious market sentiment.
- Other notable drivers include modest order book imbalances and a 7-day return of approximately +2.4%, suggesting limited short-term momentum.
ETF Flows (BTC/ETH)
Current ETF data shows significant outflows from Bitcoin over the past 1, 5, and 10 days, with daily outflows of approximately $44.6 million. Ethereum ETF flows are relatively stable, with minor inflows over longer periods. These flows suggest a risk-off environment, with investors reducing exposure to major crypto assets, which provides context but is not directly predictive for XRP.
What to Watch Next
- Monitor the daily close relative to key support ($1.86) and resistance ($1.94) levels for potential trend shifts.
- Observe macro market sentiment and ETF flows, especially the continued Bitcoin outflows, as an indicator of risk appetite.
- Keep an eye on broader crypto volatility and momentum indicators to assess potential for short-term reversals.
- Watch for any breakout signals above $1.94 or breakdown below $1.86 to confirm directional moves.
Hashtags: #XRP #CryptoAnalysis #Bitcoin #Ethereum #MarketUpdate #TechnicalAnalysis #CryptoTrends #ETFFlows #RiskOff #CryptoMarket #PriceLevels #Investing