Market Snapshot
On January 29, 2026, Solana (SOL) is trading around $115.86, with a short-term bias leaning upward at approximately 55%. The market exhibits very low volatility and an oversold RSI of 20, indicating potential for a rebound. Major support is positioned near $114, while resistance is around $118. A break above resistance could target levels between $120.54 and $122.90, whereas a decline below support may push prices toward $109–$111.
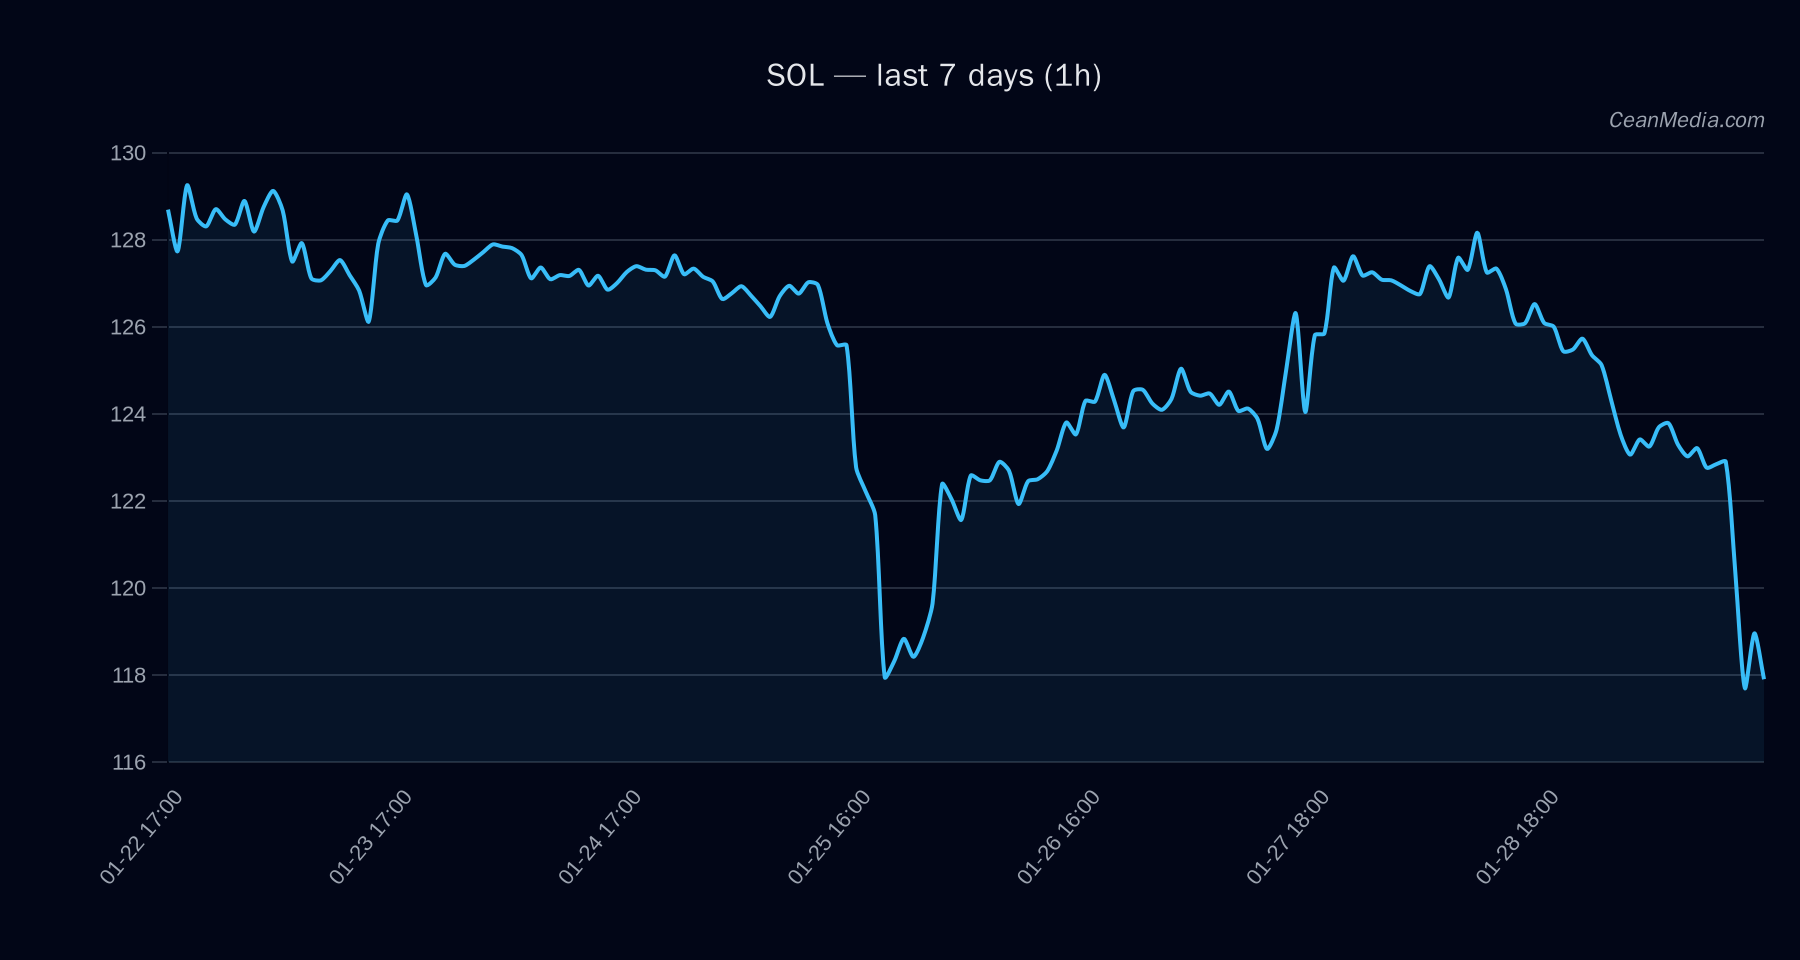
Technical Analysis: SOL
- Current Price: $115.86
- Support Levels: Major at $114, Near at $114
- Resistance Levels: Major at $129, Near at $118
- Key Indicators:
- EMA12 < EMA26 (Bearish)
- SMA50 < SMA200 (Bearish)
- RSI: 20 (Oversold)
- Volatility: Very Low
- Forecast: Slight upward bias with a 55% confidence, but overall TA remains bearish due to EMA and SMA alignments.
- Invalidation: A close below $114 would confirm further downside, targeting $109–$111.
Drivers
- Return over 24H: -0.07, indicating slight weakness.
- EMA Slope: -0.0048, suggesting a marginal bearish trend.
- Funding Z-Score: -1.28, reflecting negative funding sentiment.
- Basis Z-Score: -2.18, indicating potential downside pressure.
- Order Book Imbalance (EMA5): -0.01, showing slight sell-side dominance.
- BTC 24H Return: -0.07, correlating with minor market weakness.
- BTC Trend Strength: 2.15, indicating moderate trend strength in Bitcoin.
- Market sentiment remains cautious, with oversold conditions on SOL and low volatility supporting a possible short-term rebound.
ETF Flows (BTC/ETH)
Recent ETF flows reveal a risk-off environment, with Bitcoin ETFs experiencing significant outflows over the past 10 days (-$1.22B), while Ethereum ETFs have seen inflows (+$80.2M in 5 days). These flows suggest a cautious market sentiment, primarily impacting Bitcoin and Ethereum, and should be viewed as contextual rather than primary signals for SOL’s technical outlook.
What to Watch Next
- Monitor if SOL breaks above $118 to confirm bullish momentum towards $120–$122.
- Watch for a close below $114, which could accelerate downside towards $109–$111.
- Keep an eye on Bitcoin and Ethereum ETF flows for broader risk sentiment cues.
- Observe changes in RSI and volatility for signs of reversal or continuation.
Hashtags: #Solana #CryptoAnalysis #MarketUpdate #ETFFlows #TechnicalAnalysis #CryptoTrading #Blockchain #DigitalAssets #CryptoNews #SOL #BTC #ETH