Market Snapshot
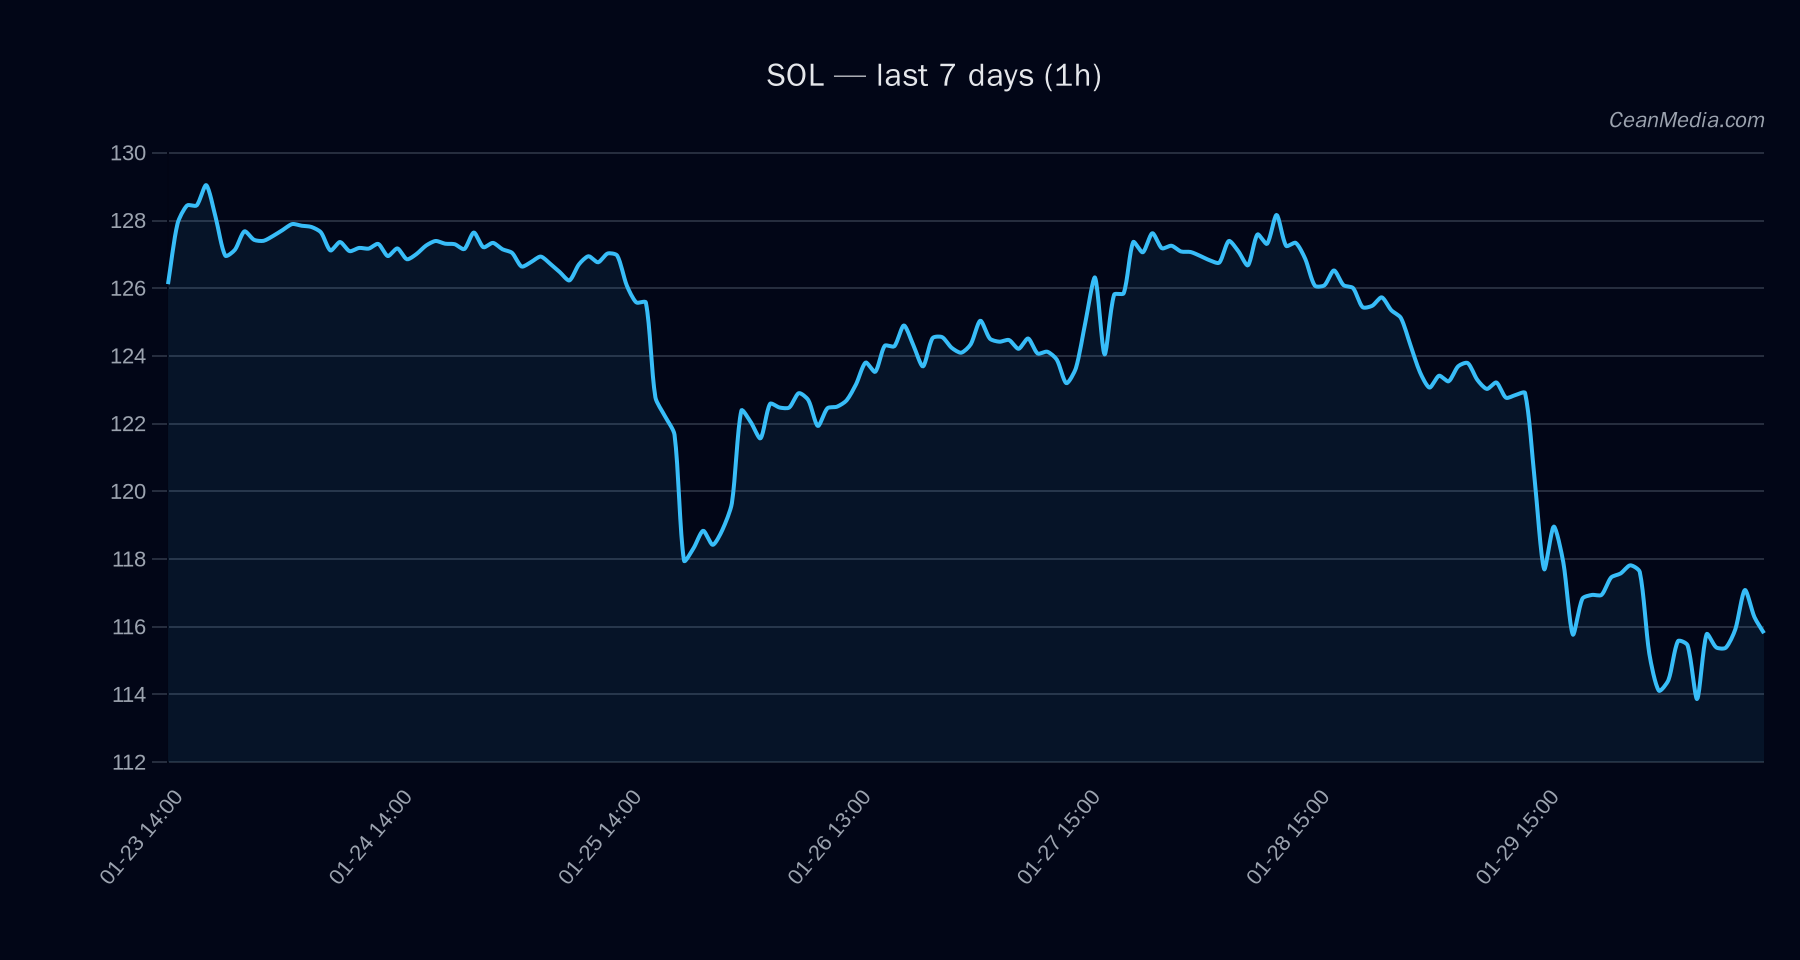
As of January 30, 2026, Solana (SOL) trades around $115.86 with a short-term forecast indicating a 49% probability of upward movement. The current technical environment shows a bearish trend, with key indicators pointing to potential support and resistance levels that could influence price action in the near term.
Technical Analysis: SOL
- Levels: Support at $114 (near), major support at $123; Resistance at $118 (near), major resistance at $129.
- Bias: Bearish trend indicated by EMA12 < EMA26, SMA50 < SMA200, and RSI at 42.
- Triggers: A daily close above $118 could trigger a move towards $120.54–$122.90. Conversely, a close below $114 could see a decline towards $109–$111.
- Invalidation: Breakdown below $114 may invalidate bullish scenarios and confirm continued downside momentum.
Drivers
- Top factors: Slight negative return over 24 hours (-0.06%), EMA slope marginally negative (-0.0004), and funding/basis Z-scores indicating slight bearish pressure (-1.58 and -1.72 respectively).
- Momentum & Volatility: BTC-related metrics show a mild trend strength (1.54) and low volatility regime; overall market breadth remains subdued, with a fear sentiment index at 16 (Extreme Fear).
ETF Flows (BTC/ETH)
Recent ETF flows show significant outflows from both Bitcoin and Ethereum ETFs, with Bitcoin ETF outflows at approximately $1.91 billion over ten days and Ethereum ETFs declining by about $269.6 million in the same period. These flows suggest a risk-off environment in the broader crypto market, which may influence Solana indirectly as part of the overall sentiment, although ETF data pertains only to BTC and ETH and should be considered as contextual rather than primary signals for SOL.
What to Watch Next
- Monitor the price action around the $118 resistance level for potential breakout or rejection signals.
- Observe daily closes below $114 for signs of further downside momentum.
- Keep an eye on broader market sentiment, especially the ongoing ETF outflows in BTC and ETH, as an indicator of risk appetite.
- Watch for changes in key technical indicators, including RSI and moving averages, to gauge potential trend reversals.
Hashtags: #Solana #CryptoAnalysis #MarketUpdate #BTC #ETH #CryptoFlows #TechnicalAnalysis #Altcoins #Trading #Blockchain #Investment #CryptoTrends