Market Snapshot
As of January 31, 2026, BNB is trading near key support levels with a current price of approximately $808.9. The broader market sentiment shows a cautious tone, with the cryptocurrency experiencing low volatility and an extreme fear index reading. Bitcoin and Ethereum ETF flows indicate a mixed risk environment, with Bitcoin seeing inflows and Ethereum experiencing outflows, suggesting slight risk-on sentiment in traditional crypto assets.
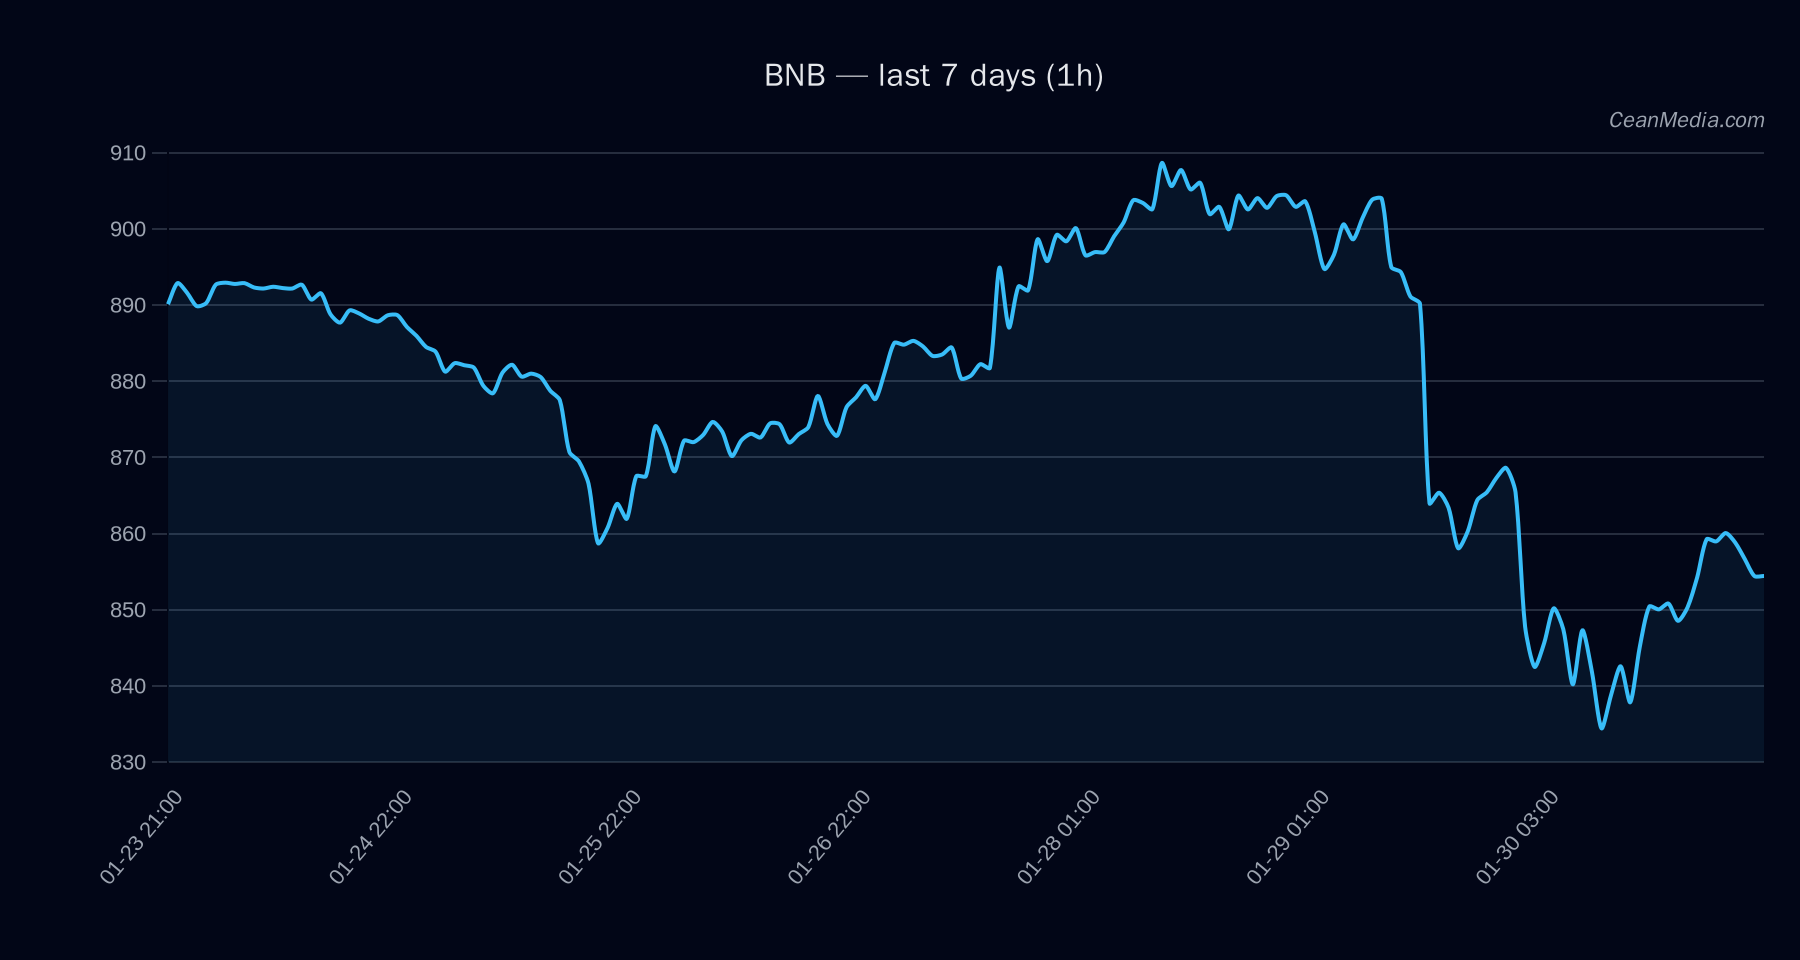
Technical Analysis: BNB
BNB’s short-term technical outlook is bearish, with the current price positioned between major support at $793 and resistance at $825. A break above $825 could propel BNB towards the $841–858 range, while a decline below $793 might see prices fall to $761–777. The technical indicators reveal oversold conditions: EMA12 is below EMA26, SMA50 is below SMA200, and RSI is at 23, indicating strong oversold momentum. The market’s volatility regime remains low, supporting the potential for a breakout or breakdown once key levels are tested.
Drivers
- Return 24H: Slight positive at 0.01%
- EMA Slope: Neutral, indicating no clear trend momentum
- Funding Z-Score: -0.04, suggesting minimal funding pressure
- Basis Z-Score: -1.61, indicating potential undervaluation
- Order Book Imbalance (EMA5): -0.17, hinting at selling pressure
- BTC Return 24H: 0.02%, supporting a mildly positive risk environment
- BTC Trend Strength: 1.22, signaling moderate upward momentum in Bitcoin
The overall technical stance remains bearish but oversold conditions suggest a potential rebound if key resistance levels are breached convincingly.
ETF Flows (BTC/ETH)
Recent ETF flow data shows Bitcoin ETFs with a 1-day inflow of +$15.6 million, but larger outflows over 5 and 10 days, totaling -$527.6 million and -$1.87 billion respectively. Ethereum ETFs, on the other hand, experienced a 1-day outflow of -$96.9 million, with continued net outflows over 5 and 10 days. This mixed flow pattern indicates a cautious risk-on/off environment, with investors showing slight preference for Bitcoin over Ethereum in recent days. It is important to note that these ETF flows serve as contextual insights and are not primary signals for BNB’s price movement.
What to Watch Next
- Monitor BNB’s reaction at the $793 support and $825 resistance levels for potential breakout or breakdown signals.
- Watch Bitcoin’s trend strength and ETF flows for broader risk sentiment cues.
- Observe any shifts in technical indicators, especially RSI and moving averages, for signs of trend reversal.
- Keep an eye on macroeconomic developments and market sentiment indices, given the current extreme fear reading.
Hashtags: #BNB #CryptoAnalysis #MarketOutlook #TechnicalAnalysis #ETFFlows #Bitcoin #Ethereum #CryptoNews #RiskOn #RiskOff #MarketSentiment #CryptoTrading