Market Snapshot
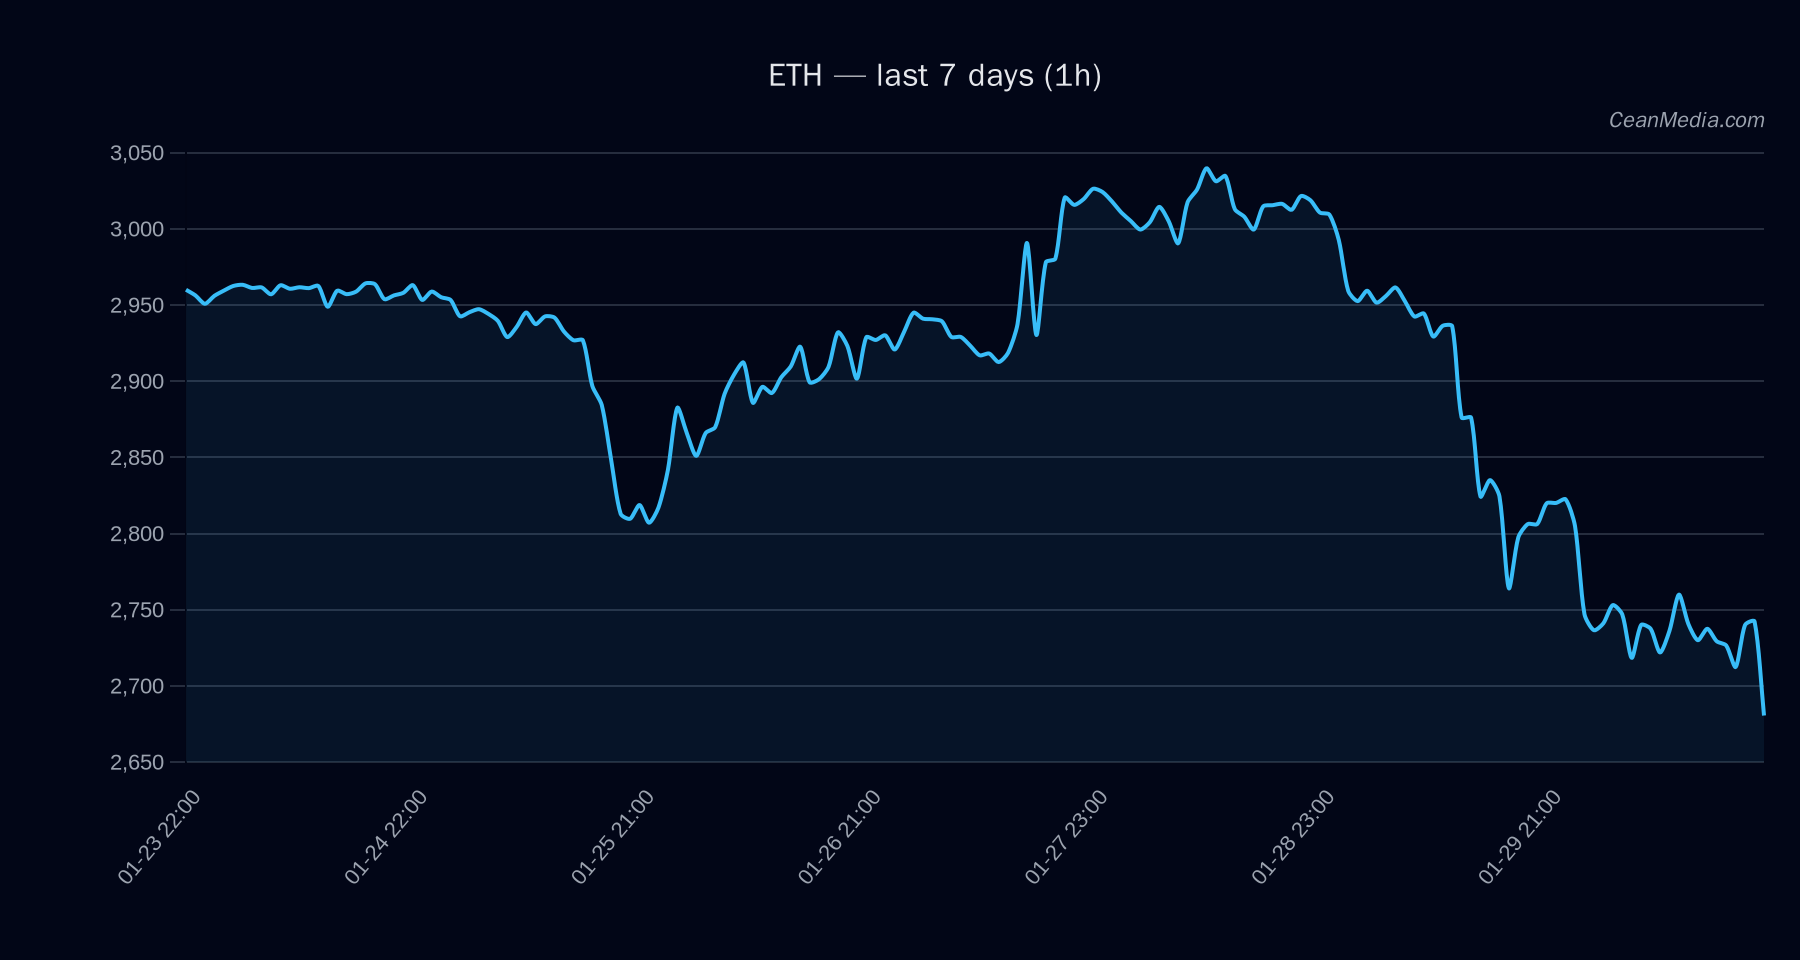
As of January 31, 2026, Ethereum (ETH) is trading around the 2,710 USD level, with recent market sentiment indicating a bearish bias. The broader market remains cautious, with low volatility and a fear-driven sentiment as reflected by the Fear Index at extreme levels. ETF flows continue to show significant outflows from both Bitcoin and Ethereum products, highlighting risk-off sentiment among institutional investors.
Technical Analysis: ETH
ETH is currently positioned between key support at approximately 2,656 USD and resistance at around 2,764 USD. A break above 2,764 USD could signal a move towards 2,820–2,875 USD, while a decline below 2,656 USD may target levels near 2,550 USD. The short-term forecast remains bearish with a 50% probability, supported by technical indicators such as EMA12 Invalidation of the bullish trigger would occur if ETH closes below the support at 2,656 USD, reinforcing the bearish outlook. Conversely, a daily close above 2,764 USD would be needed to confirm potential short-term strength. Recent ETF flow data indicates significant outflows for both Bitcoin and Ethereum ETFs, with BTC experiencing around $500 million daily outflows and ETH around $103 million. Over the past five days, BTC ETF outflows have totaled approximately $646.7 million, while ETH ETFs have seen about $25.2 million in outflows. This pattern suggests a broad risk-off environment, with investors reducing exposure to crypto assets. It is important to note that ETF flows are only a context for market sentiment and should not be solely relied upon for trading decisions. Note: ETF flow data is only available for BTC and ETH and provides context rather than a primary trading signal. Hashtags: #Ethereum #CryptoAnalysis #MarketUpdate #ETFFlows #TechnicalAnalysis #CryptoTrends #Bitcoin #RiskOff #MarketSentiment #TradingStrategies #CryptoNews #FinancialMarketsDrivers
ETF Flows (BTC/ETH)
What to Watch Next