Market Snapshot
Solana (SOL) is trading near key support and resistance around the 83.9–87.4 band. The near-term forecast is sideways with a small 3% range, reflecting subdued volatility (σ24h 0.43%) and a very low overall volatility regime. Market breadth is positive, while BTC dominance and alt breadth show constructive signals. Overall sentiment appears mixed, with subtle upside and downside risks evident in the option-like banding and current RSI near neutral levels.
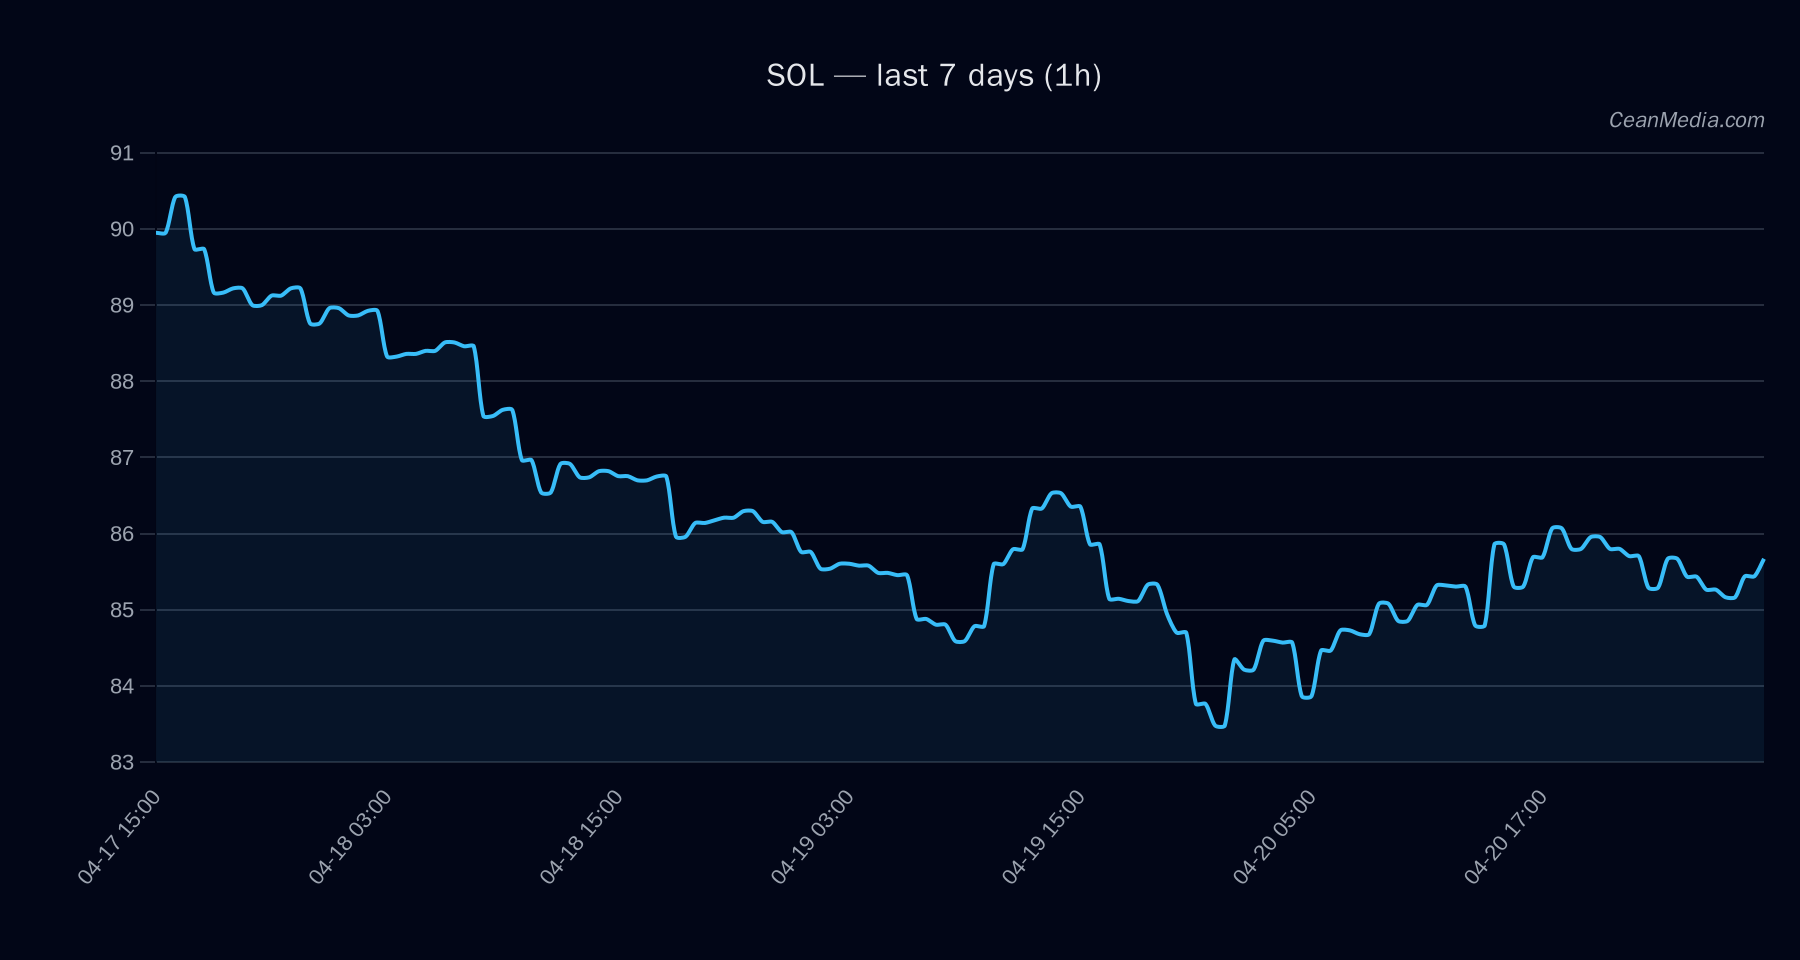
Technical Analysis: SOL
- Current price: 85.64–85.67
- Trend indicators: EMA12 > EMA26; SMA50 < SMA200; RSI ~53
- Volatility: σ24h = 0.43%; Vol regime: Very low
- Band and key levels: P20–P80 band 79.525 – 91.550; Support: Major 81.5, Near 83.9; Resistance: Major 87.3, Near 87.4
- Forecast: Sideways (3%)
- Probability split: Up ~48%, Side ~3%, Down ~49%
Tricks for triggers: A close > 87.4 suggests upside into 89.10–90.85; a close < 83.9 suggests downside into 82.25–80.57.
- Invalidation / bias: Break above 87.4 maintains upside targets within the indicated band; break below 83.9 enhances downside risk near 80–82.
Drivers
- Top drivers (contributions to SOL model): LS GLOBAL Z-SCORE, LS TOP Z-SCORE, SPREAD Z-SCORE, LIQ IMB Z-SCORE, BTC RETURN 24H
- Momentum and volatility: Trend strength remains modest; low vol regime supports range-bound expectations.
- Macro context: BTC 72h trend strength is positive; alt breadth remains favorable outside mega-cap moves. Fear index (F&G) around 33 indicates cautious sentiment.
- Distance from MA and recent performance: Distance_from_ma near zero indicates a balanced positioning around key moving averages.
ETF Flows (BTC/ETH)
The ETF flow context provided is limited to BTC and ETH. BTC ETFs show a negative intraday move (-$17.6M) with modest net inflows over 5D and 10D horizons (+$927.3M, +$1.19B respectively). ETH ETFs show a similar pattern with intraday outflows (-$14.0M) and positive longer-horizon inflows (+$206.2M, +$319.4M).
Interpretation: The BTC/ETH ETF data offers a risk-on/off backdrop for broader market sentiment but is not a primary signal for SOL. The flows indicate demand shifts in BTC/ETH that could influence risk preference and liquidity, rather than SOL-specific catalysts. Investors should treat ETF data as contextual alongside SOL-specific technicals and market breadth.
What to Watch Next
- Monitor price action relative to 83.9 (support) and 87.4 (resistance) for breakout cues.
- Watch for a close above 87.4 to validate upside targets toward 89.1–90.8.
- Observe changes in BTC/ETH ETF flows as a risk-on/off signal and their potential impact on SOL liquidity and risk appetite.
- Maintain awareness of volatility regime shifts, especially if σ24h moves away from the current very low level.
Hashtags: #Solana #SOL #CryptoAnalysis #TechnicalAnalysis #ETFFlows #BTC #ETH #MarketSnapshot #CryptoNews #TradingStrategy #RiskManagement #AltMarket